MCR3U (1.1) - Relations vs Functions - Grade 11 Functions
Summary
TLDRIn this educational video, Patrick explores the concept of functions by examining various mathematical relations to determine if they qualify as functions. He explains the vertical line test, a method to verify if a relation is a function by ensuring no vertical line intersects the graph at more than one point. Patrick covers linear equations, circles, parabolas, and a sideways parabola, demonstrating through examples and graphical illustrations how each relation either passes or fails the test. The video is a comprehensive guide for understanding the properties of functions in algebra.
Takeaways
- 📐 The video discusses how to determine if different relations are functions or not.
- ✅ The relation y = 3 - x is a function because it passes the vertical line test, indicating a unique y for each x.
- ⛔ A vertical line, such as x = 4, is not a function as it fails the vertical line test, having multiple y values for the same x.
- 🔵 The equation x^2 + y^2 = 16 represents a circle and is not a function because it does not pass the vertical line test, having two y values for each x.
- 📉 The parabola y = x^2 - x - 6 is a function as it passes the vertical line test, with a unique y for each x, and opens upwards due to the positive leading coefficient.
- 🔄 The relation x = y^2 - 1, when rearranged to y = ±√(x + 1), is not a function because it fails the vertical line test, having two y values for each x greater than or equal to -1.
- 📊 The video emphasizes the importance of graphing relations to visually confirm whether they are functions by applying the vertical line test.
- 📋 The script reviews the general forms of lines, circles, and parabolas, and how their properties relate to the vertical line test.
- 🚫 A sideways parabola, like the one in the fourth example, is not a function because it has multiple y values for the same x.
- 📘 The video suggests that if unsure, one should review how to graph different types of functions from previous math courses to better understand and apply the vertical line test.
Q & A
What is the relation described by the equation y = 3 - x?
-The relation described by the equation y = 3 - x is a linear function. It represents a straight line with a slope of -1 and a y-intercept of 3.
How can you determine if the line y = 3 - x is a function?
-You can determine if y = 3 - x is a function by applying the vertical line test. Since no vertical line intersects the graph of this equation more than once, it passes the test and is indeed a function.
Why is a vertical line not considered a function?
-A vertical line is not considered a function because it fails the vertical line test. There are multiple points on the line that can be intersected by a single vertical line, indicating that there are multiple y-values for a single x-value.
What type of geometric shape does the equation x^2 + y^2 = 16 represent?
-The equation x^2 + y^2 = 16 represents a circle with a radius of 4 units, centered at the origin of a Cartesian coordinate system.
Why does the circle defined by x^2 + y^2 = 16 fail the vertical line test?
-The circle defined by x^2 + y^2 = 16 fails the vertical line test because for any given x-value, there are two corresponding y-values (one positive and one negative), indicating that it is not a function.
What is the relation represented by the equation y = x^2 - x - 6?
-The relation represented by the equation y = x^2 - x - 6 is a quadratic function, which graphs as a parabola. It factors into (x - 3)(x + 2), indicating x-intercepts at x = 3 and x = -2.
Is the parabola y = x^2 - x - 6 a function? How do you know?
-Yes, the parabola y = x^2 - x - 6 is a function. It passes the vertical line test because for any given x-value, there is only one corresponding y-value.
What is the equation x = y^2 - 1 transformed into when solved for y?
-When the equation x = y^2 - 1 is solved for y, it becomes y = ±√(x + 1). This transformation indicates that y is defined for all x values greater than or equal to -1.
Why does the graph of x = y^2 - 1 fail the vertical line test?
-The graph of x = y^2 - 1 fails the vertical line test because for certain x-values, there are two possible y-values (one positive and one negative), which means there are multiple y-values for a single x-value.
What is the key difference between a function and a non-function in terms of the vertical line test?
-The key difference is that a function will pass the vertical line test, meaning that no vertical line will intersect the graph of the function more than once. A non-function will fail this test, as there will be at least one vertical line that intersects the graph at more than one point.
What general rule can be applied to determine if a line is a function?
-The general rule is that any line that is not vertical is a function because it will pass the vertical line test. A vertical line, on the other hand, is not a function as it fails the test.
Outlines

This section is available to paid users only. Please upgrade to access this part.
Upgrade NowMindmap

This section is available to paid users only. Please upgrade to access this part.
Upgrade NowKeywords

This section is available to paid users only. Please upgrade to access this part.
Upgrade NowHighlights

This section is available to paid users only. Please upgrade to access this part.
Upgrade NowTranscripts

This section is available to paid users only. Please upgrade to access this part.
Upgrade NowBrowse More Related Video

Introduction to Functions (2 of 2: Examples & Counter-Examples)
THE LANGUAGE OF RELATIONS AND FUNCTIONS || MATHEMATICS IN THE MODERN WORLD
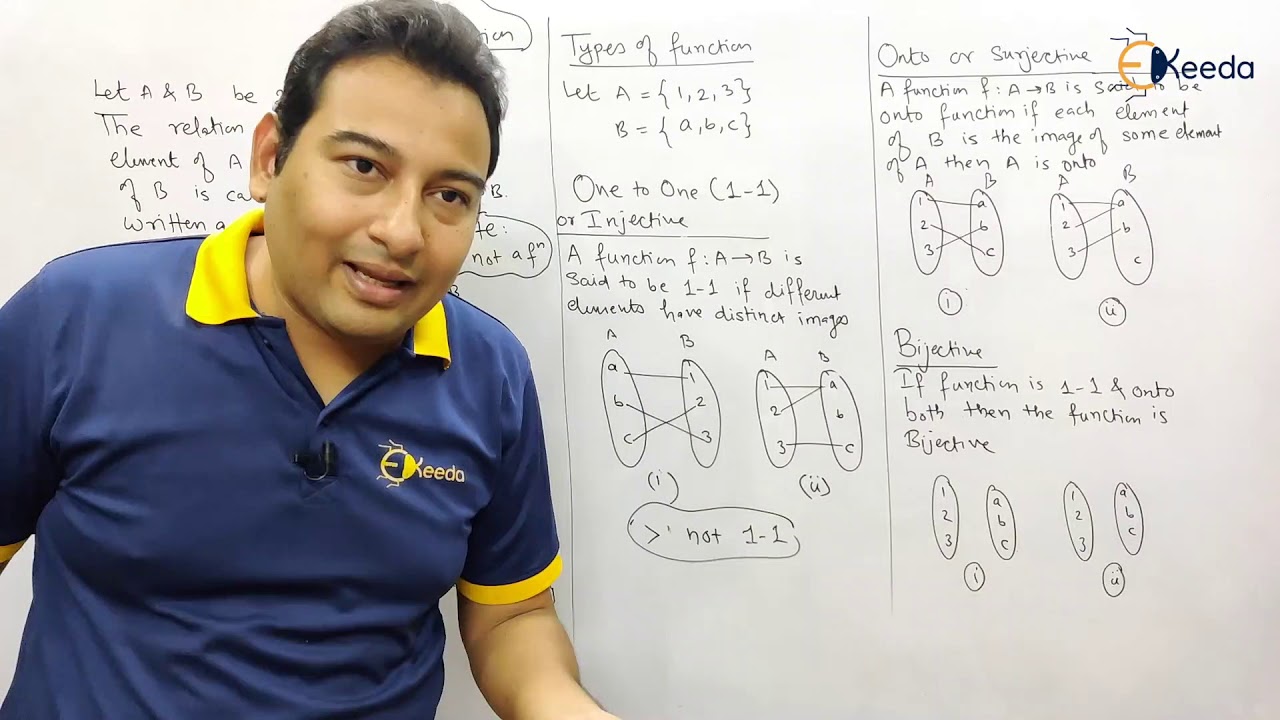
Introduction to Function and Types of Function - Functions - Discrete Mathematics

Matematika SMA - Relasi dan Fungsi (4) - Sifat-Sifat Fungsi, Fungsi Injektif Surjektif (A)
Materi Matematika Kelas 8: Relasi dan Fungsi
Relation and Functions || MATHEMATICS IN THE MODERN WORLD
5.0 / 5 (0 votes)