Create Gantt Chart | Oracle APEX - Part 30
Summary
TLDRTech Mining's video tutorial introduces Gantt charts for project planning, highlighting their ability to streamline complex projects by scheduling tasks, identifying dependencies, and calculating minimum delivery times. The guide demonstrates creating a Gantt chart using a table with SQL queries, loading data from a CSV file, and configuring chart properties to visualize task progress and dependencies. The final result showcases a dynamic chart that updates project status, offering a clear overview of completion and schedules.
Takeaways
- 📈 A Gantt chart is a tool for effectively planning complex projects by listing all tasks, their start dates, duration, and dependencies.
- 📅 It helps in determining the minimum delivery time for a project and scheduling resources when they are available.
- 🔍 To create a Gantt chart, you start by creating a table and populating it with relevant project data.
- 🔗 The source code for the Gantt chart functionality is provided in the video description for further reference.
- 💾 The process involves running a query to create a 'project table' in the workspace schema and loading data from a CSV file.
- 🖥️ Access the 'data load and unload' page to load data into the project table using a specified CSV file.
- 📊 After loading the data, you can view and interact with the table to ensure the data is correctly appended.
- 📝 Open the sales web application to start creating the Gantt chart by selecting the 'chart' option and then 'Gantt'.
- 🔑 Define the start and end dates, task ID, task name, and other properties for the Gantt chart using column mapping.
- 📈 Set the 'status' column to map progress on the Gantt chart, indicating the task's completion status.
- 🔄 Use the zoom buttons to navigate the Gantt chart, viewing tasks at different scales for better understanding.
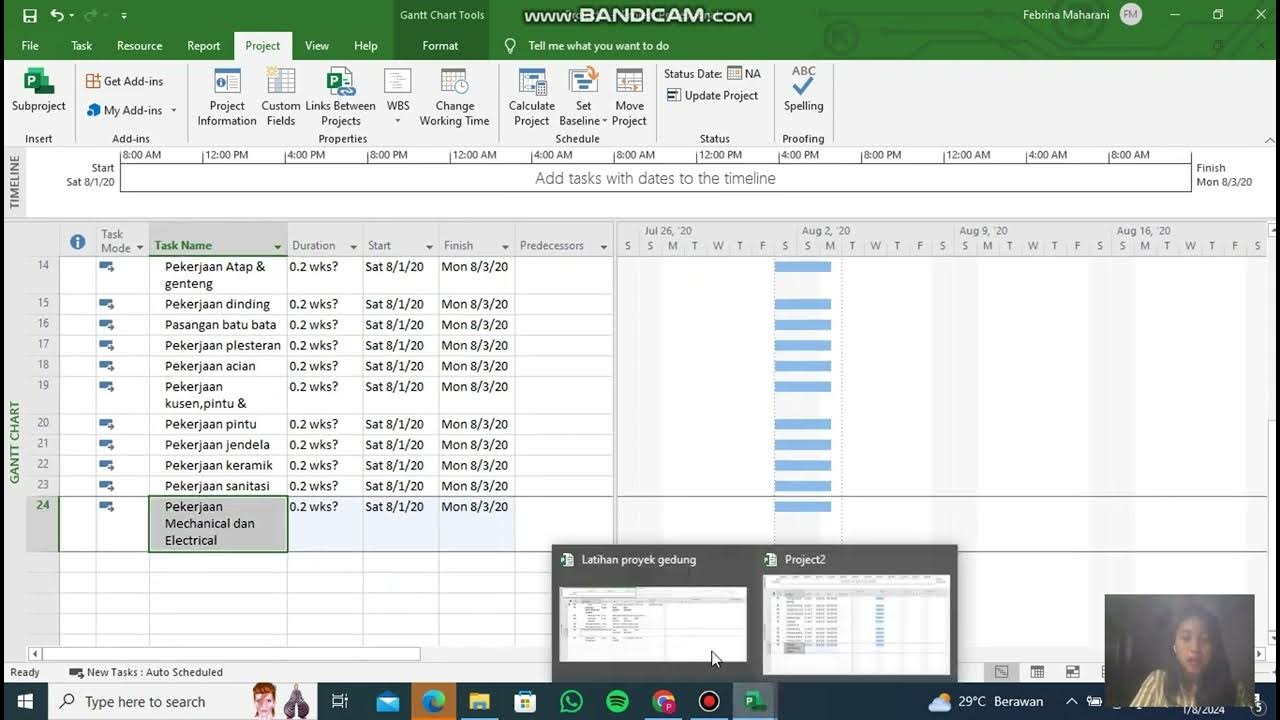
- 📊 The Gantt chart visually represents the project's progress, with same-day tasks in diamond shapes, completed tasks in dark blue, and remaining tasks in light blue.
Q & A
What is the main purpose of a Gantt chart in project management?
-A Gantt chart is used to effectively plan complex projects by enabling the planning of all tasks in one place, helping to determine the minimum delivery time for the project, and scheduling when the right people are available to complete the tasks.
How does a Gantt chart help in planning project tasks?
-A Gantt chart helps by listing all the tasks needed to complete a project, specifying the earliest start date for each activity, estimating the duration of each task, and identifying dependencies between tasks.
What is the first step in creating a Gantt chart as described in the script?
-The first step is to create a table and populate it with relevant data, which includes tasks, start dates, durations, and dependencies.
Where can I find the source code for creating a Gantt chart as mentioned in the video?
-The source code can be found in the description of the video, with a link provided there.
How do you load data into the project table in the script?
-You access the data load and unload page, click the load data button, choose the project table CSV file from the part 8 folder, select the existing table option, and then click the load data button.
What does the message 'data in table project table appended with 73 new rows' indicate?
-This message indicates that the data loading process was successful, and 73 new rows of data have been added to the project table.
How can you view the data in the project table after loading it?
-You can view the data by clicking the 'view table' button at the bottom of the data load confirmation screen.
What is the role of the 'chart option' in the sales web application?
-The 'chart option' in the sales web application allows users to select and configure different types of charts, including the Gantt chart, for visualizing project data.
What are the column mappings needed to define a Gantt chart in the script?
-The column mappings needed include start date, end date, task ID, task name, task start date, and task end date.
How is the task progress represented on the Gantt chart in the script?
-The task progress is represented by the 'status' column, which defines the progress of each task on the Gantt chart.
What visual cues are used in the Gantt chart to represent different task statuses?
-Same day tasks are shown in diamond shapes, completed tasks are represented in dark blue color, and remaining tasks are displayed in light blue colors.
How can you get more details about a specific task on the Gantt chart?
-You can get more details about a specific task by hovering the mouse pointer over the task bar on the Gantt chart.
Outlines
📈 Introduction to Gantt Charts for Project Planning
This paragraph introduces the concept of Gantt charts as a tool for planning complex projects effectively. It explains how Gantt charts help in planning tasks, determining the minimum delivery time, and scheduling resources. The process of creating a Gantt chart involves listing all tasks, specifying start dates, durations, and dependencies. The tutorial also guides viewers on how to create a table with relevant data, load data from a CSV file, and view the data in a table. The source code for the project is mentioned to be available in the video description.
🔍 Utilizing Gantt Charts in Sales Web Application
The second paragraph focuses on the practical application of Gantt charts within a sales web application. It details the steps to access and use the Gantt chart feature, including enabling zoom buttons for navigation, identifying tasks by their shapes and colors, and viewing task details on hover. The paragraph concludes by emphasizing the Gantt chart's role in displaying the overall progress of a project, offering a visual representation of completed and remaining tasks.
Mindmap
Keywords
💡Gantt Chart
💡Project
💡Task
💡Minimum Delivery Time
💡Dependencies
💡Table
💡Source Code
💡Data Load and Unload
💡SQL Query
💡Column Mapping
💡Progress
Highlights
A Gantt chart is introduced as a tool for effective planning of complex projects.
It allows planning of all tasks in one place and calculation of the minimum delivery time.
The chart helps in scheduling based on the availability of the right people to complete tasks.
The creation process of a Gantt chart is explained, starting with listing all project tasks.
Specification of the earliest start date for each activity is necessary.
Estimation of the duration for each task and their dependencies is required.
A table must be created and populated with relevant data for the Gantt chart.
Source code for creating the Gantt chart is provided in the video description.
Demonstration of creating a table named 'project table' in the workspace schema.
Instructions on how to load data from a CSV file into the 'project table'.
Confirmation of data loading with a message and the option to view the table.
The table columns and existing data are presented for review.
Opening the sales web application to utilize the Gantt chart functionality.
Selection of the Gantt chart option within the application.
Entering a SQL query to define the source type for the Gantt chart.
Setting properties for the start date, end date, task ID, task name, and task start date.
Mapping the 'status' column to define task progress on the Gantt chart.
Instructions on saving the progress and testing the Gantt chart functionality.
Visual representation of the Gantt chart with different colors for tasks' statuses.
Explanation of how to use zoom features and hover for task details in the Gantt chart.
The Gantt chart's ability to display the overall progress of a project is highlighted.
Transcripts
a very warm welcome to Tech mining
a Gantt chart allows you to effectively
plan your complex projects
it enables you to plan all of your tasks
in one place and helps you work out the
minimum delivery time for your project
and schedule when the right people are
available to complete it
Gantt chart starts by listing all the
tasks you need to complete to finish
your project
you also need to specify the earliest
date you can start each activity how
long you think each will take and
whether any of them are dependent on the
completion of other activities
let's create this Gantt chart
to understand this chart functionality
first you need to create a table and
populate it with relevant data
link of source code is provided in
description of this video by opening
part 8 folder you'll get the material
used
[Music]
to run this query click this run button
[Music]
this query will create a table named
project table in our workspace schema
access the data load and unload page
click this load data button
click choose file
open part 8 folder
then click this project table CSV file
to open it
[Music]
click the existing table option
[Music]
select the project table
[Music]
then click the load data button
if everything goes well the next screen
appears with the message data in table
project table appended with 73 new rows
click this view table button at the
bottom to complete the process
[Music]
this is the table we have created these
are all the columns in this table
click this data tab to view the existing
data in this table
foreign
[Music]
T chart
[Music]
open sales web application
[Music]
click the chart option
then select Gantt option
[Music]
foreign
[Music]
query for Source type
[Music]
then enter this query in the SQL query
box
[Music]
remaining properties will remain the
same
click next
[Music]
this first option select the column name
to be used for defining the start date
of the Gantt chart
this one select the column name to be
used for defining the end date
[Music]
this option select the column name to be
used for defining the task ID on the
Gantt chart
task name for defining the task name on
the Gantt chart
[Music]
this one select the column name for
defining the task start date on the
Gantt chart
this last option select the column name
to be used for defining the task and
date on the Gantt chart
[Music]
after creating the page click this
series one node
then set progress under column mapping
to status
the status column defines the task
progress on the Gantt chart
save your progress by clicking the save
page button
that's it let's test our work
run the application
[Music]
open this reports page
[Music]
click this Gantt chart card
foreign
to enable these Zoom buttons on your
keyboard press and hold the control key
then move the mouse wheel upward
[Music]
keep clicking the zoom out icon unless
it is grayed out
[Music]
same day tasks are shown in diamond
shapes
completed tasks are represented in dark
blue color while remaining tasks are
displayed in light blue colors
hovering the mouse pointer over a bar
shows details of that particular task
this Gantt chart displays the overall
progress of a project
thanks for watching
Посмотреть больше похожих видео
5.0 / 5 (0 votes)