Statistics For Data Science | Data Science Tutorial | Simplilearn

Simplilearn
28 Aug 201720:17

Summary

TLDRThis script offers an insightful overview of statistics, a mathematical science for data collection, analysis, and interpretation. It distinguishes between statistical and non-statistical analysis, emphasizing the former's ability to reveal patterns and trends. The script delves into descriptive and inferential statistics, explaining their roles in summarizing data and making inferences about populations. It introduces key statistical concepts, measures, and terms, and demonstrates how to perform descriptive and inferential analysis using SAS software, including hypothesis testing and the application of various parametric and non-parametric tests.

Takeaways

  • 📚 Statistics is a mathematical science for the collection, presentation, analysis, and interpretation of data, crucial for simplifying complex real-world problems and making informed decisions.
  • 🔍 There are two main types of analysis: statistical (quantitative) and non-statistical (qualitative), with statistical analysis providing deeper insights and clearer pictures through data patterns and trends.
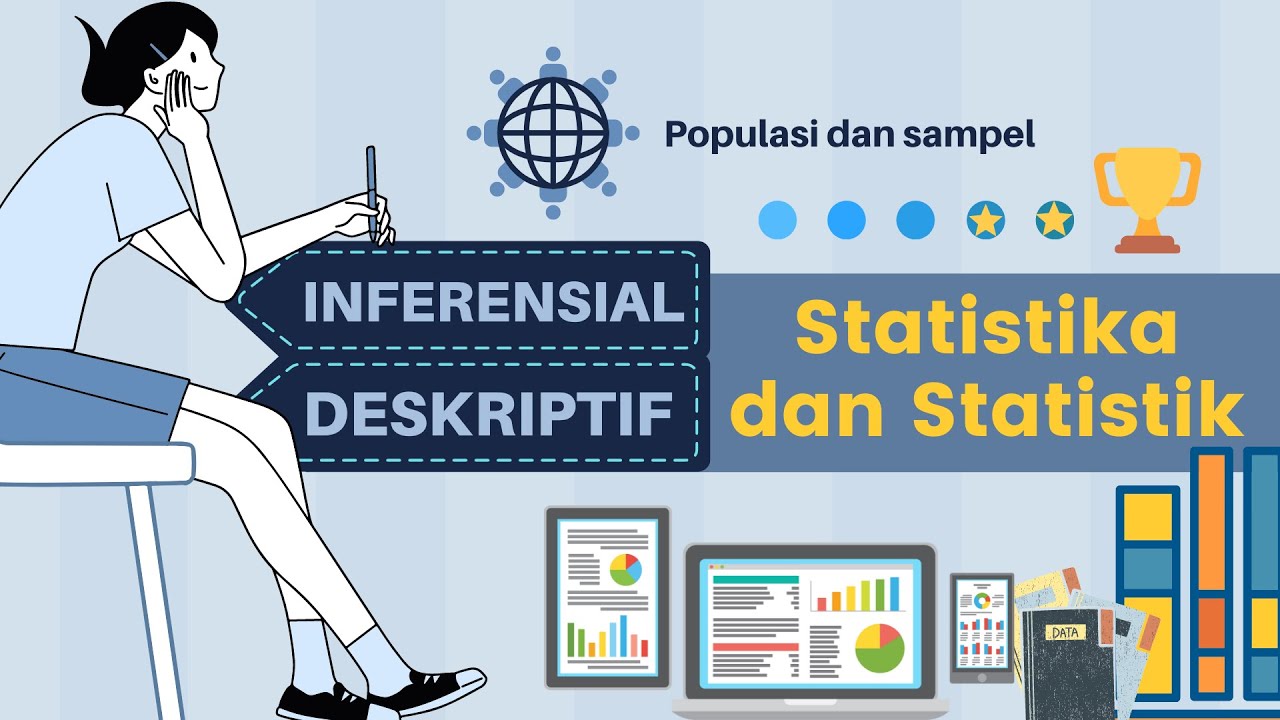
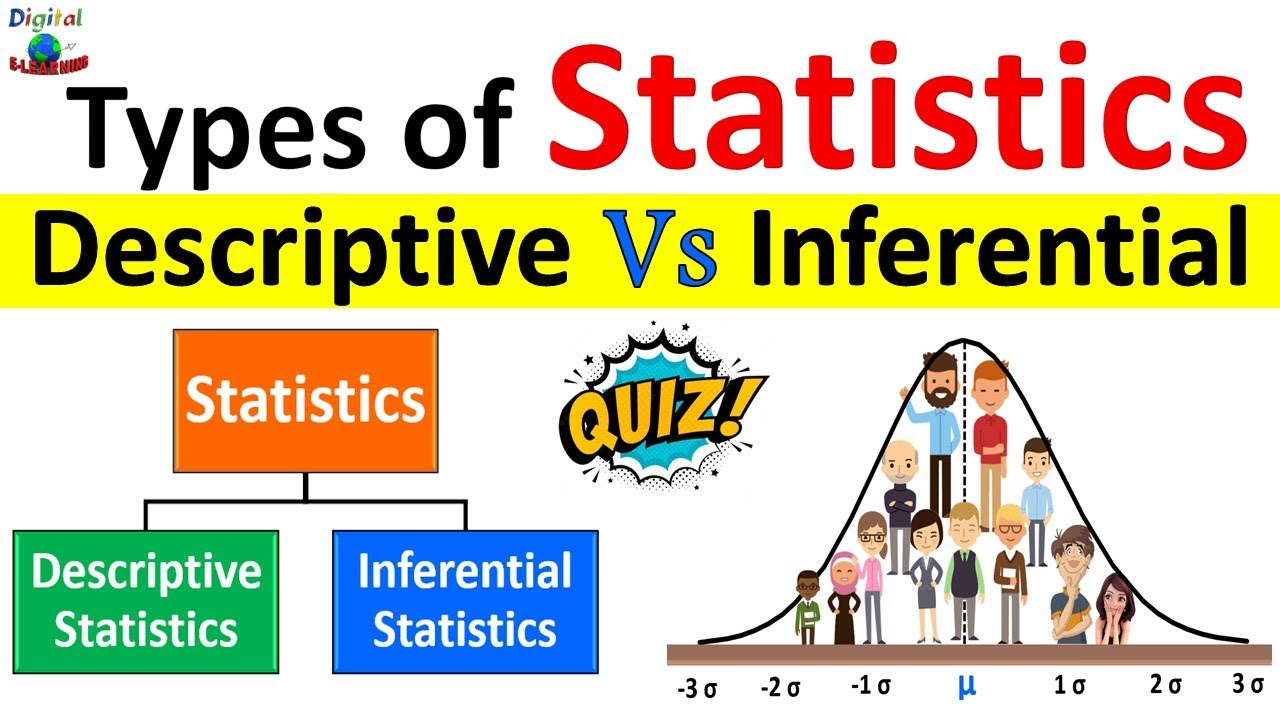
  • 📈 Descriptive statistics organizes data and summarizes its main characteristics using measures like average, mode, standard deviation, and correlation.
  • 🔎 Inferential statistics uses probability theory to generalize from a sample to a larger population, allowing for predictions and modeling of relationships within the data.
  • 📝 The script introduces key statistical terms such as population, sample, variable, and different types of variables including quantitative, qualitative, discrete, and continuous.
  • 📊 Descriptive statistics involves measures of frequency, central tendency, spread, and position to provide a comprehensive understanding of data.
  • 🛠️ The Statistical Analysis System (SAS) offers various procedures for performing descriptive statistics, such as proc print, proc contents, proc means, and proc frequency.
  • 🧐 Hypothesis testing is an inferential technique to determine if there's sufficient evidence in a data sample to infer a condition holds true for the entire population.
  • 📉 Different types of variables are categorized based on their nature: nominal, ordinal, interval, and ratio, each with distinct properties and uses in statistical analysis.
  • 📝 The script explains hypothesis testing procedures in SAS, including setting up a null hypothesis, choosing an alpha value, and conducting a t-test to check the validity of the hypothesis.
  • 📊 The advantages and disadvantages of both parametric and non-parametric tests are highlighted, with parametric tests providing detailed population information but requiring specific distributional assumptions, while non-parametric tests are more flexible but less efficient.

Q & A

  • What is the definition of statistics as mentioned in the script?

    -Statistics is defined as a mathematical science related to the collection, presentation, analysis, and interpretation of data, which is used to understand and simplify complex real-world problems for making well-informed decisions.

  • How does statistical analysis differ from non-statistical analysis?

    -Statistical analysis, also known as quantitative analysis, involves collecting, exploring, and presenting large amounts of data to identify patterns and trends. In contrast, non-statistical analysis, or qualitative analysis, provides generic information and may include text, sound, still images, and moving images but does not delve into numerical data patterns.

  • What are the two major categories of statistics?

    -The two major categories of statistics are descriptive statistics and inferential statistics. Descriptive statistics organize and summarize data, while inferential statistics generalize from a sample to draw conclusions about a larger population.

  • Can you explain the role of descriptive statistics in analyzing data?

    -Descriptive statistics help to organize data and focus on its main characteristics. It provides a summary of the data, either numerically or graphically, using measures such as average, mode, standard deviation, and correlation to describe the features of a dataset.

  • What is inferential statistics and how does it apply to data analysis?

    -Inferential statistics generalizes from a larger dataset and applies probability theory to draw conclusions. It allows for the inference of population parameters based on sample statistics and to model relationships within the data, which helps in developing mathematical equations that describe the inner relationships between variables.

  • What is the purpose of hypothesis testing in inferential statistics?

    -Hypothesis testing is an inferential statistical technique used to determine if there is enough evidence in a data sample to infer that a certain condition holds true for the entire population. It involves testing whether the identified conclusions from a sample correctly represent the population as a whole.

  • What are the differences between a null hypothesis and an alternative hypothesis?

    -The null hypothesis is a statement of no effect or no difference, assumed to be true unless there is strong evidence to the contrary. The alternative hypothesis is any hypothesis other than the null, and it is assumed to be true when the null hypothesis is proven false.

  • What are the different types of variables mentioned in the script?

    -The script mentions several types of variables: population, sample, quantitative, qualitative, discrete, and continuous. A population is the entire group from which data is collected, a sample is a subset of this population, and quantitative and qualitative variables differ in whether they measure quantity or quality, respectively. Discrete variables do not have values between given values, while continuous variables can have any value within a range.

  • What are the four types of statistical measures used to describe data?

    -The four types of statistical measures used to describe data are measures of frequency, measures of central tendency, measures of spread, and measures of position. Frequency measures how often a data value occurs, central tendency shows where data values tend to cluster, spread describes the variability of the data, and position identifies the location of a data value within the dataset.

  • Can you describe the role of the PROC MEANS procedure in SAS for descriptive statistics?

    -The PROC MEANS procedure in SAS is used for data summarization. It computes descriptive statistics for variables across all observations and within groups of observations, providing insights into the central tendency, variability, and other summary measures of the dataset.

  • What is the significance of hypothesis testing procedures like parametric and non-parametric tests?

    -Hypothesis testing procedures, both parametric and non-parametric, are significant for making inferences about a population based on sample data. Parametric tests make assumptions about the population distribution and are used when the data meets certain criteria, while non-parametric tests make fewer assumptions and are used when the data does not meet the assumptions required for parametric tests.

Outlines

00:00

📊 Introduction to Statistics and Its Importance

The first paragraph introduces the concept of statistics as a mathematical science for data collection, presentation, analysis, and interpretation. It highlights the role of statistics in simplifying complex real-world problems for informed decision-making. The paragraph distinguishes between statistical and non-statistical analysis, with the former being quantitative and revealing patterns and trends through data exploration. It also outlines the two major categories of statistics: descriptive, which organizes and summarizes data, and inferential, which generalizes findings to larger datasets using probability theory. Examples such as student heights in a classroom illustrate these concepts, emphasizing the prevalence of statistics in everyday life and business.

05:02

📈 Descriptive and Inferential Statistics with SAS Demo

This paragraph delves into the specifics of descriptive statistics, detailing measures like average, mode, standard deviation, and correlation used to describe data sets. It provides a practical example of analyzing student heights using descriptive methods. The paragraph then transitions to inferential statistics, explaining how it uses sample data to infer population parameters and model relationships. A demonstration using SAS software is described, showing how to import a dataset and use procedures like 'proc means' to analyze data. The concept of hypothesis testing as a part of inferential statistics is introduced, explaining the null and alternative hypotheses in the context of a pharmaceutical company's safety claims.

10:03

🔍 Understanding Variables and Hypothesis Testing in Statistics

The third paragraph focuses on the categorization of variables in statistics, distinguishing between nominal, ordinal, interval, and ratio variables. It explains the characteristics of each type with examples, such as gender for nominal and the Fahrenheit scale for interval variables. The paragraph also discusses the importance of recognizing variable types before statistical testing. A demonstration using SAS for hypothesis testing is provided, including a t-test example to determine if the mean delivery time deviates from a hypothesized value. The explanation includes the concepts of null hypothesis, alternative hypothesis, and p-values in the context of statistical significance.

15:06

🧐 Hypothesis Testing Techniques and Their Applications

This paragraph explores various hypothesis testing procedures, starting with an overview of parametric tests such as t-tests, ANOVA, chi-square, and linear regression. It describes the scenarios where each test is applicable, such as comparing means or assessing variances between groups. The paragraph also introduces non-parametric tests like the Wilcoxon rank sum test and Kruskal-Wallis H-test, which do not require strict distributional assumptions. Advantages and disadvantages of both parametric and non-parametric tests are listed, providing insight into their respective use cases and limitations in statistical analysis.

20:08

📚 Conclusion and Invitation to Learn More on Big Data

The final paragraph serves as a conclusion, summarizing the importance of understanding statistical methods and hypothesis testing for big data analysis. It encourages viewers to subscribe to the Simply Learn channel for more educational content on big data and to gain expertise in the field. The paragraph ends with a call to action, inviting the audience to watch more videos on the topic and pursue certification.

Mindmap

Keywords

💡Statistics

Statistics is defined as a mathematical science that deals with the collection, presentation, analysis, and interpretation of data. It is integral to the video's theme as it forms the basis for understanding complex real-world problems and making informed decisions. The script uses statistics to differentiate between quantitative and qualitative analysis, highlighting its role in simplifying complex data into actionable insights.

💡Descriptive Statistics

Descriptive statistics is a subfield of statistics that focuses on summarizing and organizing data to describe its main features. In the video, this concept is used to illustrate how numerical measures like average, mode, and standard deviation can provide a summary of a dataset, such as the heights of students in a classroom, which helps in understanding the central tendencies and variations within the data.

💡Inferential Statistics

Inferential statistics is another key concept in the video, which involves making generalizations and predictions about a larger dataset based on a sample. It uses probability theory to infer population parameters and model relationships within the data. The script explains how inferential statistics can categorize and sample data to make broader conclusions, such as classifying student heights as tall, medium, or short.

💡Population

A population in the context of the video refers to the entire group from which data is collected. It is a fundamental concept in statistics, as it represents the whole set of individuals or items of interest. The script mentions that a sample is a subset of this population, and statistical analysis often involves making inferences about the population based on samples.

💡Sample

A sample is a subset of the population that is used for analysis in statistics. The video script explains that a sample is taken to represent the larger population, and statistical methods are applied to this sample to make inferences about the population as a whole, which is a common practice in both descriptive and inferential statistics.

💡Variable

In the video, a variable is described as a feature characteristic of any member of the population that differs in quality or quantity from another member. Variables are essential in statistical analysis as they represent the data points that are measured or observed, such as the height of students in the classroom example used throughout the script.

💡Quantitative Variable

A quantitative variable is a type of variable that differs in quantity and can be measured numerically. The script provides examples such as the weight of a person or the number of people in a car, emphasizing that quantitative variables are crucial for statistical calculations and analyses.

💡Qualitative Variable

Qualitative variables, also known as attributes, are those that differ in quality and are typically categorical. The video script uses examples like color or the degree of damage in a car accident to illustrate how qualitative variables are used to classify data into distinct categories for analysis.

💡Hypothesis Testing

Hypothesis testing is an inferential statistical technique discussed in the video, used to determine if there is enough evidence in a sample to infer that a certain condition holds true for the entire population. The script explains the process of formulating null and alternative hypotheses and how they are used to test claims about population parameters.

💡Parametric Tests

Parametric tests are a category of statistical tests that assume a specific probability distribution for the data and are used when certain parameters of the population are known. The video script mentions several parametric tests such as t-tests and ANOVA, explaining their use in analyzing differences between groups or relationships between variables.

💡Non-Parametric Tests

Non-parametric tests are statistical tests that do not require strict distributional assumptions about the data. The video script contrasts these with parametric tests, noting that non-parametric tests like the Wilcoxon rank sum test and Kruskal-Wallis H-test are used when the data does not meet the assumptions required for parametric tests.

Highlights

Statistics is defined as a mathematical science for data collection, presentation, analysis, and interpretation.

Statistics helps in simplifying complex real-world problems for well-informed decision-making.

Statistical analysis can be divided into two types: statistical (quantitative) and non-statistical (qualitative).

Descriptive statistics organizes data and focuses on its main characteristics, using measures like average, mode, and standard deviation.

Inferential statistics uses probability theory to generalize findings from a sample to a larger population.

Descriptive statistics can summarize data numerically or graphically, such as finding maximum, minimum, and average values.

Inferential statistics categorizes data and uses samples to infer population parameters and model relationships.

The impact of statistics is evident in daily life, from home routines to the operation of major cities.

Key statistical terms include population, sample, variable, quantitative variable, qualitative variable, discrete variable, and continuous variable.

There are four types of statistical measures: frequency, central tendency, spread, and position.

SAS provides various procedures for performing descriptive statistics, such as PROC MEANS and PROC FREQUENCY.

Hypothesis testing is an inferential statistical technique used to determine if a condition holds true for an entire population based on a sample.

Hypothesis testing involves the null hypothesis and the alternative hypothesis, used to make conclusions about population parameters.

Variables in hypothesis testing are classified into nominal, ordinal, interval, and ratio types.

Parametric tests like t-test and ANOVA are used when the population distribution is known, while non-parametric tests are used when it's not.

Parametric tests provide information about population parameters and relationships between variables, but require normally distributed data.

Non-parametric tests are simpler, make fewer assumptions, and do not require data to be normally distributed.

Examples of non-parametric tests include the Wilcoxon rank sum test and the Kruskal-Wallis H-test.

The advantages and disadvantages of parametric and non-parametric tests are discussed, highlighting their applicability and limitations.

Transcripts

play00:06

[Music]

play00:09

let's begin this lesson by defining the

play00:11

term statistics

play00:13

statistics is a mathematical science

play00:15

pertaining to the collection

play00:17

presentation analysis and interpretation

play00:20

of data

play00:21

it's widely used to understand the

play00:23

complex problems of the real world and

play00:25

simplify them to make well-informed

play00:27

decisions

play00:28

several statistical principles functions

play00:31

and algorithms can be used to analyze

play00:33

primary data build a statistical model

play00:36

and predict the outcomes

play00:38

an analysis of any situation can be done

play00:41

in two ways statistical analysis or a

play00:45

non-statistical analysis

play00:47

statistical analysis is the science of

play00:49

collecting exploring and presenting

play00:51

large amounts of data to identify the

play00:53

patterns and trends

play00:55

statistical analysis is also called

play00:57

quantitative analysis

play00:59

non-statistical analysis provides

play01:01

generic information and includes text

play01:04

sound still images and moving images

play01:07

non-statistical analysis is also called

play01:10

qualitative analysis although both forms

play01:13

of analysis provide results statistical

play01:15

analysis gives more insight and a

play01:17

clearer picture

play01:19

a feature that makes it vital for

play01:20

businesses

play01:22

there are two major categories of

play01:24

statistics descriptive statistics and

play01:27

inferential statistics

play01:29

descriptive statistics helps organize

play01:31

data and focuses on the main

play01:33

characteristics of the data

play01:35

it provides a summary of the data

play01:37

numerically or graphically

play01:39

numerical measures such as average mode

play01:42

standard deviation or sd and correlation

play01:45

are used to describe the features of a

play01:47

data set

play01:48

suppose you want to study the height of

play01:50

students in a classroom

play01:52

in the descriptive statistics you would

play01:54

record the height of every person in the

play01:56

classroom and then find out the maximum

play01:58

height minimum height and average height

play02:01

of the population

play02:03

inferential statistics generalizes the

play02:05

larger data set and applies probability

play02:07

theory to draw a conclusion

play02:10

it allows you to infer population

play02:11

parameters based on the sample

play02:13

statistics and to model relationships

play02:15

within the data

play02:17

modeling allows you to develop

play02:18

mathematical equations which describe

play02:21

the inner relationships between two or

play02:23

more variables

play02:24

consider the same example of calculating

play02:26

the height of students in the classroom

play02:28

in inferential statistics you would

play02:30

categorize height as tall

play02:33

medium and small and then take only a

play02:35

small sample from the population to

play02:38

study the height of students in the

play02:39

classroom

play02:40

the field of statistics touches our

play02:42

lives in many ways from the daily

play02:45

routines in our homes to the business of

play02:47

making the greatest cities run the

play02:49

effect of statistics are everywhere

play02:52

there are various statistical terms that

play02:54

one should be aware of while dealing

play02:56

with statistics

play02:57

population sample variable quantitative

play03:01

variable qualitative variable discrete

play03:04

variable continuous variable

play03:07

a population is the group from which

play03:09

data is to be collected

play03:12

a sample is a subset of a population

play03:17

a variable is a feature that is

play03:19

characteristic of any member of the

play03:21

population differing in quality or

play03:23

quantity from another member

play03:25

a variable differing in quantity is

play03:28

called a quantitative variable for

play03:30

example the weight of a person number of

play03:32

people in a car

play03:35

a variable differing in quality is

play03:37

called a qualitative variable or

play03:39

attribute for example color the degree

play03:42

of damage of a car in an accident

play03:45

a discrete variable is one which no

play03:47

value can be assumed between the two

play03:49

given values

play03:50

for example the number of children in a

play03:53

family

play03:55

a continuous variable is one in which

play03:57

any value can be assumed between the two

play03:59

given values

play04:01

for example the time taken for a 100

play04:03

meter run

play04:05

typically there are four types of

play04:07

statistical measures used to describe

play04:09

the data

play04:10

they are measures of frequency measures

play04:13

of central tendency measures of spread

play04:16

measures of position

play04:18

let's learn each in detail

play04:20

frequency of the data indicates the

play04:22

number of times a particular data value

play04:24

occurs in the given data set

play04:26

the measures of frequency are number and

play04:29

percentage

play04:31

central tendency indicates whether the

play04:33

data values tend to accumulate in the

play04:35

middle of the distribution or toward the

play04:37

end

play04:38

the measures of central tendency are

play04:40

mean

play04:40

median and mode

play04:43

spread describes how similar or varied

play04:46

the set of observed values are for a

play04:48

particular variable

play04:50

the measures of spread are standard

play04:51

deviation variance and quartiles

play04:54

the measure of spread are also called

play04:56

measures of dispersion

play04:59

position identifies the exact location

play05:01

of a particular data value in the given

play05:03

data set

play05:04

the measures of position are percentiles

play05:07

quartiles and standard scores

play05:09

statistical analysis system or sas

play05:12

provides a list of procedures to perform

play05:14

descriptive statistics

play05:16

they are as follows

play05:18

proc print

play05:19

proc contents

play05:21

proc means

play05:22

proc frequency proc univariate

play05:25

proc g chart

play05:27

proc box plot

play05:29

proc g plot

play05:31

proc print

play05:32

it prints all the variables in a sas

play05:34

data set

play05:36

proc contents it describes the structure

play05:39

of a data set

play05:41

proc means

play05:42

it provides data summarization tools to

play05:45

compute descriptive statistics for

play05:46

variables across all observations and

play05:49

within the groups of observations

play05:52

proc frequency

play05:54

it produces one way to inway frequency

play05:57

and cross tabulation tables

play05:59

frequencies can also be an output of a

play06:01

sas data set

play06:04

proc univariate

play06:06

it goes beyond what proc means does and

play06:09

is useful in conducting some basic

play06:11

statistical analyses and includes high

play06:13

resolution graphical features

play06:16

proc g chart

play06:17

the g chart procedure produces six types

play06:20

of charts block charts horizontal

play06:22

vertical bar charts

play06:24

pi doughnut charts and star charts

play06:27

these charts graphically represent the

play06:29

value of a statistic calculated for one

play06:32

or more variables in an input sas data

play06:34

set

play06:35

the tread variables can be either

play06:37

numeric or character

play06:40

proc box plot

play06:42

the box plot procedure creates side by

play06:44

side box and whisker plots of

play06:46

measurements organized in groups

play06:48

a box and whisker plot displays the mean

play06:51

quartiles and minimum and maximum

play06:53

observations for a group

play06:56

proc g-plot

play06:58

g-plot procedure creates two-dimensional

play07:00

graphs including simple scatter plots

play07:02

overlay plots in which multiple sets of

play07:05

data points are displayed on one set of

play07:07

axes

play07:08

plots against the second vertical axis

play07:10

bubble plots and logarithmic plots

play07:14

in this demo you'll learn how to use

play07:16

descriptive statistics to analyze the

play07:18

mean from the electronic data set

play07:20

let's import the electronic data set

play07:22

into the sas console

play07:24

in the left plane right-click the

play07:27

electronic.xlsx dataset and click import

play07:30

data

play07:32

the code to import the data generates

play07:34

automatically

play07:36

copy the code and paste it in the new

play07:38

window

play07:46

the proc means procedure is used to

play07:48

analyze the mean of the imported data

play07:50

set

play07:54

the keyword data identifies the input

play07:56

data set

play07:57

in this demo the input data set is

play08:00

electronic

play08:03

the output obtained is shown on the

play08:05

screen

play08:07

note that the number of observations

play08:09

mean standard deviation and maximum and

play08:12

minimum values of the electronic data

play08:14

set are obtained

play08:17

this concludes the demo on how to use

play08:19

descriptive statistics to analyze the

play08:21

mean from the electronic data set

play08:24

so far you've learned about descriptive

play08:26

statistics

play08:27

let's now learn about inferential

play08:29

statistics

play08:30

hypothesis testing is an inferential

play08:33

statistical technique to determine

play08:35

whether there is enough evidence in a

play08:36

data sample to infer that a certain

play08:39

condition holds true for the entire

play08:41

population

play08:42

to understand the characteristics of the

play08:44

general population we take a random

play08:46

sample and analyze the properties of the

play08:48

sample

play08:49

we then test whether or not the

play08:51

identified conclusions correctly

play08:53

represent the population as a whole

play08:55

the population of hypothesis testing is

play08:58

to choose between two competing

play08:59

hypotheses about the value of a

play09:01

population parameter

play09:03

for example

play09:05

one hypothesis might claim that the

play09:07

wages of men and women are equal while

play09:09

the other might claim that women make

play09:11

more than men

play09:13

hypothesis testing is formulated in

play09:15

terms of two hypotheses

play09:17

null hypothesis which is referred to as

play09:21

alternative hypothesis which is referred

play09:23

to as h1

play09:26

the null hypothesis is assumed to be

play09:28

true unless there is strong evidence to

play09:30

the contrary

play09:31

the alternative hypothesis is assumed to

play09:33

be true when the null hypothesis is

play09:35

proven false

play09:37

let's understand the null hypothesis and

play09:39

alternative hypothesis using a general

play09:41

example

play09:43

null hypothesis attempts to show that no

play09:45

variation exists between variables and

play09:48

alternative hypothesis is any hypothesis

play09:50

other than the null

play09:52

for example say a pharmaceutical company

play09:55

has introduced a medicine in the market

play09:56

for a particular disease and people have

play09:59

been using it for a considerable period

play10:01

of time and it's generally considered

play10:03

safe

play10:04

if the medicine is proved to be safe

play10:06

then it is referred to as null

play10:08

hypothesis

play10:10

to reject null hypothesis we should

play10:12

prove that the medicine is unsafe

play10:14

if the null hypothesis is rejected then

play10:17

the alternative hypothesis is used

play10:20

before you perform any statistical tests

play10:23

with variables it's significant to

play10:25

recognize the nature of the variables

play10:27

involved

play10:28

based on the nature of the variables

play10:30

it's classified into four types

play10:33

they are categorical or nominal

play10:35

variables ordinal variables

play10:38

interval variables and ratio variables

play10:42

nominal variables are ones which have

play10:44

two or more categories and it's

play10:46

impossible to order the values

play10:48

examples of nominal variables include

play10:50

gender and blood group

play10:52

ordinal variables have values ordered

play10:55

logically however the relative distance

play10:57

between two data values is not clear

play11:00

examples of ordinal variables include

play11:02

considering the size of a coffee cup

play11:04

large medium and small and considering

play11:07

the ratings of a product bad good and

play11:10

best

play11:11

interval variables are similar to

play11:13

ordinal variables except that the values

play11:15

are measured in a way where their

play11:17

differences are meaningful

play11:19

with an interval scale equal differences

play11:21

between scale values do have equal

play11:23

quantitative meaning

play11:25

for this reason an interval scale

play11:27

provides more quantitative information

play11:29

than the ordinal scale

play11:31

the interval scale does not have a true

play11:33

zero point a true zero point means that

play11:35

a value of zero on the scale represents

play11:38

zero quantity of the construct being

play11:40

assessed examples of interval variables

play11:43

include the fahrenheit scale used to

play11:45

measure temperature and distance between

play11:48

two compartments in a train

play11:51

ratio scales are similar to interval

play11:52

scales in that equal differences between

play11:55

scale values have equal quantitative

play11:57

meaning

play11:58

however ratio scales also have a true

play12:01

zero point which give them an additional

play12:03

property

play12:04

for example the system of inches used

play12:06

with a common ruler is an example of a

play12:08

ratio scale there is a true zero point

play12:11

because zero inches does in fact

play12:13

indicate a complete absence of length

play12:17

in this demo you'll learn how to perform

play12:19

the hypothesis testing using

play12:22

sas this example let's check against the

play12:26

length of certain observations from a

play12:28

random sample

play12:30

the keyword data identifies the input

play12:32

data set

play12:35

the input statement is used to declare

play12:37

the aging variable and cards to read

play12:40

data into sas

play12:54

let's perform a t-test to check the null

play12:56

hypothesis

play13:04

let's assume that the null hypothesis to

play13:06

be that the mean days to deliver a

play13:08

product is six days

play13:13

so null hypothesis equals six

play13:16

alpha value is the probability of making

play13:18

an error which is 5 percent standard and

play13:21

hence alpha equals 0.05

play13:26

the variable statement names the

play13:28

variable to be used in the analysis

play13:41

the output is shown on the screen

play13:45

note that the p-value is greater than

play13:47

the alpha value which is 0.05 therefore

play13:51

we fail to reject the null hypothesis

play13:56

this concludes the demo on how to

play13:58

perform the hypothesis testing using sas

play14:02

let's now learn about hypothesis testing

play14:05

procedures

play14:06

there are two types of hypothesis

play14:07

testing procedures

play14:09

they are parametric tests and

play14:11

non-parametric tests

play14:13

in statistical inference or hypothesis

play14:15

testing the traditional tests such as

play14:18

t-test and anova are called parametric

play14:21

tests

play14:22

they depend on the specification of a

play14:24

probability distribution except for a

play14:27

set of free parameters

play14:29

in simple words

play14:30

you can say that if the population

play14:32

information is known completely by its

play14:34

parameter then it is called a parametric

play14:37

test

play14:38

if the population or parameter

play14:40

information is not known and you are

play14:42

still required to test the hypothesis of

play14:44

the population then it's called a

play14:46

non-parametric test

play14:49

non-parametric tests do not require any

play14:51

strict distributional assumptions

play14:54

there are various parametric tests they

play14:56

are as follows

play14:57

t-test

play14:58

anova

play15:00

chi squared

play15:01

linear regression

play15:03

let's understand them in detail

play15:05

t-test

play15:07

a t-test determines if two sets of data

play15:09

are significantly different from each

play15:11

other

play15:12

the t-test is used in the following

play15:14

situations

play15:16

to test if the mean is significantly

play15:18

different than a hypothesized value

play15:21

to test if the mean for two independent

play15:23

groups is significantly different to

play15:26

test if the mean for two dependent or

play15:28

paired groups is significantly different

play15:32

for example

play15:34

let's say you have to find out which

play15:36

region spends the highest amount of

play15:37

money on shopping

play15:39

it's impractical to ask everyone in the

play15:41

different regions about their shopping

play15:43

expenditure

play15:45

in this case you can calculate the

play15:47

highest shopping expenditure by

play15:49

collecting sample observations from each

play15:51

region

play15:52

with the help of the t-test you can

play15:54

check if the difference between the

play15:56

regions are significant or a statistical

play15:58

fluke

play16:00

anova

play16:02

anova is a generalized version of the

play16:04

t-test and used when the mean of the

play16:06

interval dependent variable is different

play16:08

to the categorical independent variable

play16:11

when we want to check variance between

play16:13

two or more groups we apply the anova

play16:16

test

play16:18

for example let's look at the same

play16:20

example of the t-test example

play16:22

now you want to check how much people in

play16:25

various regions spend every month on

play16:27

shopping

play16:28

in this case there are four groups

play16:30

namely east west

play16:32

north and south

play16:34

with the help of the anova test you can

play16:36

check if the difference between the

play16:37

regions is significant or a statistical

play16:40

fluke

play16:42

chi-square

play16:44

chi-square is a statistical test used to

play16:46

compare observed data with data you

play16:48

would expect to obtain according to a

play16:50

specific hypothesis

play16:53

let's understand the chi-square test

play16:54

through an example

play16:56

you have a data set of male shoppers and

play16:58

female shoppers

play17:00

let's say you need to assess whether the

play17:02

probability of females purchasing items

play17:04

of 500 or more is significantly

play17:07

different from the probability of males

play17:09

purchasing items of 500 or more

play17:12

linear regression

play17:14

there are two types of linear regression

play17:17

simple linear regression and multiple

play17:19

linear regression

play17:21

simple linear regression is used when

play17:23

one wants to test how well a variable

play17:25

predicts another variable

play17:28

multiple linear regression allows one to

play17:30

test how well multiple variables or

play17:32

independent variables predict a variable

play17:35

of interest

play17:36

when using multiple linear regression we

play17:38

additionally assume the predictor

play17:41

variables are independent

play17:44

for example finding relationship between

play17:46

any two variables say sales and profit

play17:49

is called simple linear regression

play17:52

finding relationship between any three

play17:54

variables say sales cost telemarketing

play17:57

is called multiple linear regression

play17:59

some of the non-parametric tests are

play18:01

wilcoxon rank sum test and

play18:04

kruskal-wallis h-test

play18:06

wilcoxon rank sum test

play18:08

the wilcoxon signed rank test is a

play18:11

non-parametric statistical hypothesis

play18:13

test used to compare two related samples

play18:16

or matched samples to assess whether or

play18:18

not their population mean ranks differ

play18:21

in wilcoxon rank some test you can test

play18:24

the null hypothesis on the basis of the

play18:26

ranks of the observations

play18:28

kruskal-wallis h-test

play18:31

kruskal-wallis h-test is a rank-based

play18:33

non-parametric test used to compare

play18:36

independent samples of equal or

play18:38

different sample sizes

play18:40

in this test you can test the null

play18:42

hypothesis on the basis of the ranks of

play18:44

the independent samples

play18:46

the advantages of parametric tests are

play18:48

as follows

play18:49

provide information about the population

play18:52

in terms of parameters and confidence

play18:54

intervals

play18:56

easier to use in modeling analyzing and

play18:58

for describing data with central

play19:00

tendencies and data transformations

play19:03

express the relationship between two or

play19:06

more variables

play19:08

don't need to convert data into rank

play19:10

order to test

play19:12

the disadvantages of parametric tests

play19:14

are as follows

play19:16

only support normally distributed data

play19:19

only applicable on variables not

play19:23

let's now list the advantages and

play19:25

disadvantages of non-parametric tests

play19:28

the advantages of non-parametric tests

play19:31

are as follows

play19:32

simple and easy to understand

play19:35

do not involve population parameters and

play19:37

a sampling theory

play19:39

make fewer assumptions

play19:41

provide results similar to parametric

play19:44

procedures

play19:45

the disadvantages of non-parametric

play19:48

tests are as follows

play19:50

not as efficient as parametric tests

play19:53

difficult to perform operations on large

play19:55

samples manually

play20:01

hey want to become an expert in big data

play20:04

then subscribe to the simply learn

play20:05

channel and click here to watch more

play20:07

such videos to nerd up and get certified

play20:09

in big data click here

Rate This

5.0 / 5 (0 votes)

Связанные теги
StatisticsData AnalysisDescriptive StatsInferential StatsHypothesis TestingSAS SoftwareQuantitative ResearchDecision MakingBig DataStatistical Models
Вам нужно краткое изложение на английском?