Elliott Wave LuxAlgo Indicator Trading Strategy + Backdate Test
Summary
TLDRIn this video, the Elliott Wave Lux Algo Indicator is explained as a tool for detecting market trade opportunities. It automatically identifies Elliott wave impulses and corrective segments on charts, using Fibonacci retracements for precision. The video covers its settings, including source, length, and zigzag features. The strategy focuses on identifying trends, reversals, and utilizing the wave count for both bullish and bearish markets. The video also shares performance data from backtesting, showing a solid win ratio and highlighting the importance of risk management when trading with this tool.
Takeaways
- 😀 The Elliott Wave Lux Algo Indicator helps traders detect market opportunities by identifying Elliott Wave impulses and corrective segments on a price chart.
- 😀 The indicator provides Fibonacci retracement levels based on impulse waves, allowing traders to better analyze market movements.
- 😀 Users can set up alerts for various trigger conditions to be notified when significant wave patterns occur.
- 😀 The 'source' setting in the indicator allows users to choose from high, close, maximum, or open prices for analysis.
- 😀 The 'length' setting determines the number of bars used to detect pivot points, with default lengths set at 4, 8, and 16.
- 😀 The Zigzag pattern helps identify pivot points and is essential for recognizing wave formations.
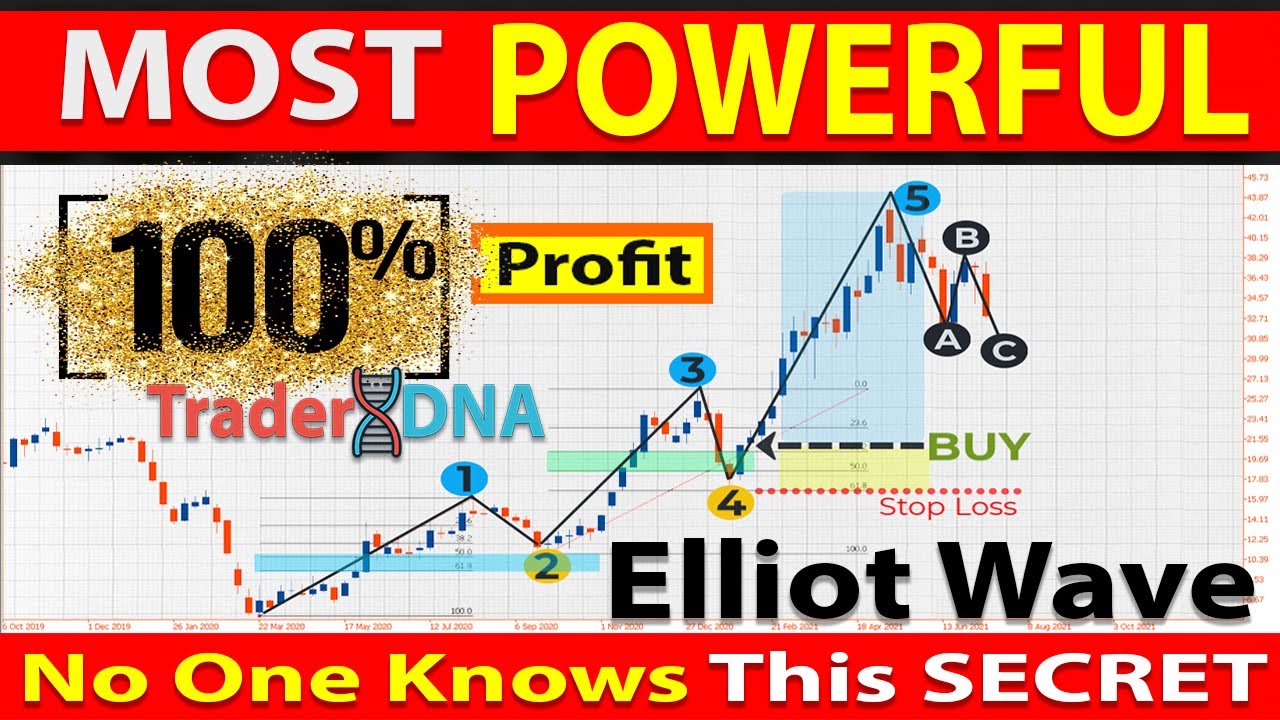
- 😀 In a bullish trend, Wave 1 represents the initial impulsive move, followed by a corrective Wave 2 that should not retrace beyond the start of Wave 1.
- 😀 Wave 3 is the strongest impulsive move in a trend, and Wave 4 should not overlap with the price territory of Wave 1.
- 😀 In a bearish trend reversal, the peak of Wave 5 indicates weakening bullish momentum, triggering the formation of a corrective ABC pattern.
- 😀 To trade the reversal of a bullish trend into a bearish one, traders look for a bearish close below the C wave, or a conservative entry at the rejection point of Wave 2.
- 😀 A total of 50 trades executed using the Elliott Wave Lux Algo Indicator resulted in a 58% win rate and a net profit of $3,700 after accounting for both trend-following and reversal strategies.
Q & A
What is the primary purpose of the Elliott Wave Lux Algo indicator?
-The Elliott Wave Lux Algo indicator is designed to automatically detect Elliott Wave impulse and corrective segments on price charts, helping traders identify market trade opportunities and trends.
Which types of waves does the indicator identify and display?
-It identifies and displays impulsive waves (1 to 5) in the direction of the trend and corrective waves (A to C) against the trend, including their subdivisions.
What are the key input settings of the indicator?
-Key input settings include source for high/low values, zigzag lengths (default 4, 8, 16), and Fibonacci retracement levels (0.5, 0.618, 0.764, 0.854).
How does the indicator determine new pivot points?
-New pivot points are determined by checking the source (high or low) and length. For example, a new pivot high occurs if the current high is lower than a previous high, with all highs in the preceding bars being lower.
What are the key rules for validating Elliott Wave patterns?
-Wave 2 cannot retrace beyond the start of Wave 1, Wave 4 must not overlap Wave 1's price territory, and Wave 3 cannot be the shortest among waves 1, 3, and 5.
How is a bullish trend confirmed using this indicator?
-A bullish trend is confirmed by identifying impulsive waves 1, 3, and 5 moving higher, with corrective waves 2 and 4 following the pattern rules, and Wave 5 exceeding Wave 3 high without overlapping previous wave territories.
What signals a potential reversal from a bullish to bearish trend?
-A potential reversal is indicated when Wave 5 shows weakness and the price forms an ABC corrective wave, with confirmation through either a close below swing C (aggressive) or a rejection at Wave 2 swing from point C (conservative).
How should traders approach reversal trades for a bearish to bullish trend?
-Traders should look for weakness in Wave 5, identify an ABC formation, and confirm the bullish reversal through a close above swing C (aggressive) or a rejection at Wave 2 swing from C (conservative).
What were the performance results for trend-following trades using this indicator?
-For 30 trend-following trades, the indicator produced 18 winning trades and 12 losing trades, yielding a net profit of $2,400.
How did reversal trades perform according to the script?
-For 20 reversal trades, there were 11 winning trades and 9 losing trades, resulting in a net profit of $1,300.
What is the overall win ratio and net profit from all trades mentioned?
-Out of 50 executed trades, there were 29 wins and 21 losses, a 58% winning ratio, with a total net profit of $3,700.
What trading precautions does the script recommend when using the indicator?
-The script advises practicing on a demo account before live trading and implementing proper risk and money management strategies for each trade.
Outlines

Этот раздел доступен только подписчикам платных тарифов. Пожалуйста, перейдите на платный тариф для доступа.
Перейти на платный тарифMindmap

Этот раздел доступен только подписчикам платных тарифов. Пожалуйста, перейдите на платный тариф для доступа.
Перейти на платный тарифKeywords

Этот раздел доступен только подписчикам платных тарифов. Пожалуйста, перейдите на платный тариф для доступа.
Перейти на платный тарифHighlights

Этот раздел доступен только подписчикам платных тарифов. Пожалуйста, перейдите на платный тариф для доступа.
Перейти на платный тарифTranscripts

Этот раздел доступен только подписчикам платных тарифов. Пожалуйста, перейдите на платный тариф для доступа.
Перейти на платный тарифПосмотреть больше похожих видео

Elliott Wave LuxAlgo Indicator Backdate Test 50x Times

BREAKOUT TradingView Indicator 💥🚀

I Tested Elliott Wave Theory with $1000 - How to Trade Elliot Wave Like a Pro - EASY STRATEGY
🔴 Most Effective "ELLIOT WAVE and FIBONACCI" Price Action Trading Strategy (Wave Trading Explained)
Elliott Wave Part 3 || Strategi Analisa

How to use Elliott Wave with Fibonacci
5.0 / 5 (0 votes)
