THIS Weekly Profile Will Change The Way You See Price, Forever
Summary
TLDRIn this video, Big Charart dives deep into understanding the weekly profile for effective trading, focusing on the importance of the 'weekly PO3' concept. He explains how price moves from internal to external range liquidity and how to spot a bearish weekly profile, particularly emphasizing the significance of 'Tuesday/Wednesday high of week' setups. Charart walks viewers through his thought process, from recognizing the weekly fair value gap to predicting price movements, illustrating how understanding these dynamics can drastically improve trading performance. The video aims to help traders anticipate market behavior for more informed decision-making.
Takeaways
- 😀 Understanding the Weekly Profile: Weekly profiles are crucial for traders, especially for those focused on trading NASDAQ or using ICT strategies. Knowing how to identify and trade these profiles is essential for successful trading.
- 😀 Key Concept – Weekly PO3: All weekly profiles are derived from the weekly PO3 (Price Order 3). Understanding this PO3 helps in recognizing patterns and anticipating price movement.
- 😀 Bullish vs. Bearish Candles: A bearish candle opens high, trades lower, and closes lower, whereas a bullish candle opens low, trades higher, and closes higher. Recognizing these candle types helps in predicting market direction.
- 😀 Price Movement and Liquidity: Price moves between internal and external range liquidity. Understanding where price is more likely to go can improve trade accuracy and help manage risk.
- 😀 The Role of Fair Value Gaps: The concept of Fair Value Gaps (FVGs) is vital in identifying market structure and potential price movements. Price often trades into these gaps before making significant moves.
- 😀 Recognizing the Weekly Profile Early: By Tuesday, you can often anticipate the weekly profile for the rest of the week, making it easier to align trades with market direction.
- 😀 The Importance of Manipulation: Price manipulates to higher or lower levels before making a significant move. Recognizing these manipulations (like weekly fair value gaps) helps in determining entry points and exit strategies.
- 😀 Wednesday High of Week (HOW) Profile: In a bearish market, the Wednesday High of the Week is a key indicator that price will likely distribute lower for the rest of the week.
- 😀 Anticipating Market Moves: By understanding price structure and key liquidity areas, traders can anticipate whether price will move higher or lower, allowing for more strategic trades.
- 😀 Key to Trading Success: Mastering concepts like the PO3 and understanding weekly profiles can dramatically improve trading performance by increasing market clarity and helping traders make informed decisions.
Q & A
What is a weekly profile in trading?
-A weekly profile in trading refers to the analysis of price movements within a week, focusing on how price opens, moves throughout the week, and closes. It is used to predict potential trends and understand market behavior, especially using patterns like the PO3 (Price Open 3).
What is the importance of understanding the weekly PO3 (Price Open 3)?
-The weekly PO3 helps identify market trends by analyzing the open, high, low, and close of a weekly candle. Understanding this pattern allows traders to predict where the price is likely to move and makes it easier to spot potential bullish or bearish trends.
What are the two key directions in which price moves according to the script?
-Price moves in two directions: from internal range liquidity to external range liquidity and from external range liquidity to internal range liquidity. This concept helps traders understand where the price might go next based on the existing market structure.
What does it mean for a candle to be bearish or bullish?
-A bearish candle opens high, moves higher to manipulate price, then drops lower and closes lower. A bullish candle, on the other hand, opens lower, moves lower to manipulate price, then rises and closes higher.
How does the weekly fair value gap affect price movement?
-When price moves into a weekly fair value gap (an area where price has not previously traded), it suggests that price may either continue to move in that direction or eventually reverse. Traders look for these gaps to predict where price may head, either toward external or internal liquidity.
Why is the weekly high of the week (Tuesday or Wednesday) important?
-The high of the week, often occurring on Tuesday or Wednesday, marks a critical point where price manipulates higher before reversing. This is important because it helps traders identify the point where the market could shift from bullish to bearish or vice versa.
What does the term 'internal range liquidity' refer to?
-Internal range liquidity refers to price levels within the current trading range that the market will seek to fill. It is contrasted with external range liquidity, which refers to price levels outside the current range where the market could potentially move toward.
What does 'manipulating higher' mean in the context of this strategy?
-Manipulating higher refers to the price moving upwards in order to take out previous highs or shake out traders before reversing direction. It is often part of a strategy to create liquidity for a market move in the opposite direction.
What role does understanding the weekly profile play in improving trading performance?
-Understanding the weekly profile allows traders to anticipate price movement more accurately, leading to better trading decisions. By knowing the likely direction of price, traders can enter trades with more confidence, improving their overall performance and profitability.
How can the weekly profile strategy be applied to a bullish market?
-In a bullish market, the weekly profile strategy would involve price opening low, manipulating to fill a bullish fair value gap, then moving higher throughout the week. The process mirrors the bearish market approach but in the opposite direction, with price rising instead of falling.
Outlines

Этот раздел доступен только подписчикам платных тарифов. Пожалуйста, перейдите на платный тариф для доступа.
Перейти на платный тарифMindmap

Этот раздел доступен только подписчикам платных тарифов. Пожалуйста, перейдите на платный тариф для доступа.
Перейти на платный тарифKeywords

Этот раздел доступен только подписчикам платных тарифов. Пожалуйста, перейдите на платный тариф для доступа.
Перейти на платный тарифHighlights

Этот раздел доступен только подписчикам платных тарифов. Пожалуйста, перейдите на платный тариф для доступа.
Перейти на платный тарифTranscripts

Этот раздел доступен только подписчикам платных тарифов. Пожалуйста, перейдите на платный тариф для доступа.
Перейти на платный тарифПосмотреть больше похожих видео
Intro to Storyline (Identifying potential start & end)

Never Miss Another Trade
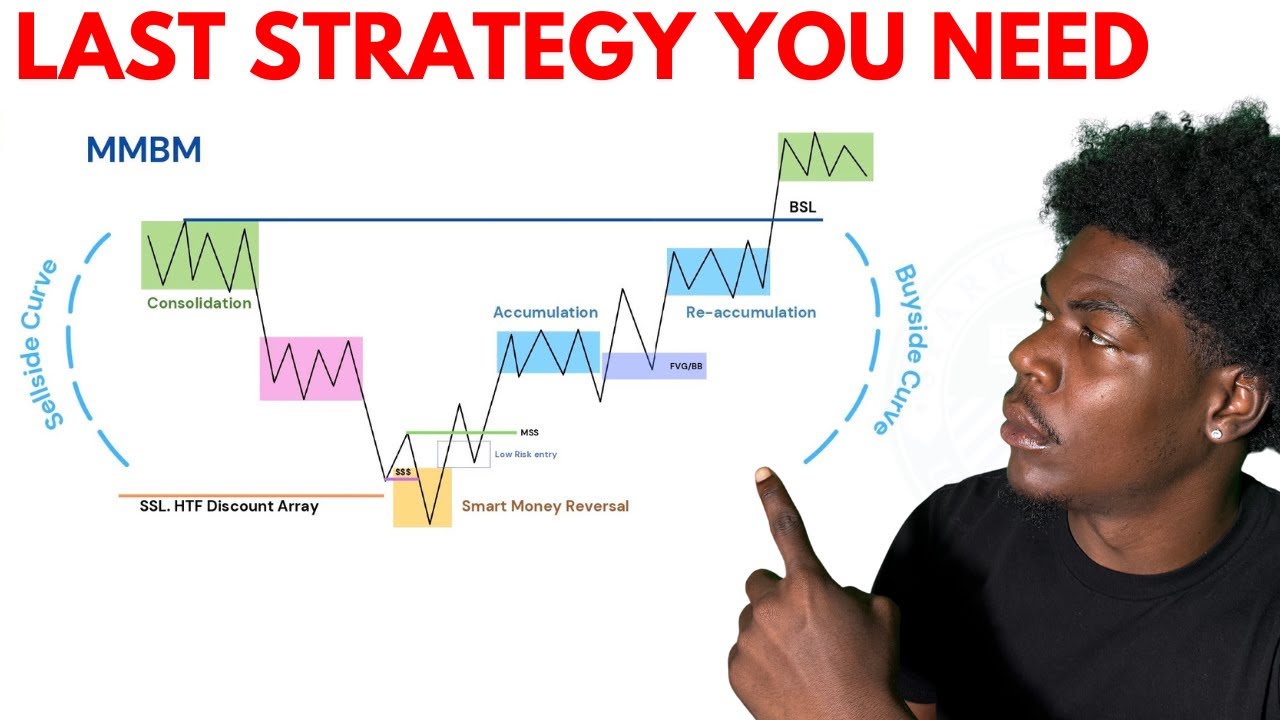
How Market Makers Trap 90% of Traders (Full MMXM Breakdown)

How to Identify and Trade Order Blocks

Weekly profile are swing points, ICT Weekly Profiles, Easy Weekly profile guide, Unlocking Profits
This Made Trading Click For Me
5.0 / 5 (0 votes)
