The ONLY Way to View Liquidity
Summary
TLDRIn this video, the presenter breaks down the concept of liquidity in interquity trading, offering a step-by-step approach that simplifies complex market dynamics. Using diagrams and real chart examples, they explain how to identify liquidity above and below key highs and lows, recognize trap moves, and determine optimal points for entering trades. Emphasis is placed on avoiding moves that still contain active sellers or buyers, waiting instead for liquidity to be run before executing trades. Multiple bullish and bearish scenarios are illustrated on NQ charts, helping viewers understand where to focus and how to make informed trading decisions with confidence.
Takeaways
- 😀 Liquidity is a key concept in trading, and understanding where it lies helps identify high-probability moves.
- 😀 Market structure consists of highs and lows, and new highs or lows can signal areas of liquidity.
- 😀 Moves that don’t take out previous liquidity points are often traps and should generally be avoided.
- 😀 Look for trades where liquidity has been cleared, as these moves tend to be more reliable and profitable.
- 😀 Both bullish and bearish moves follow the same principle: respect previous highs and lows to identify liquidity zones.
- 😀 Quick moves fueled by liquidity indicate the correct trade setup and should be the focus of trading strategies.
- 😀 Chart examples show that price often induces traders into traps before running liquidity to the real levels.
- 😀 Lower timeframe analysis can help identify finer liquidity points and validate trade setups.
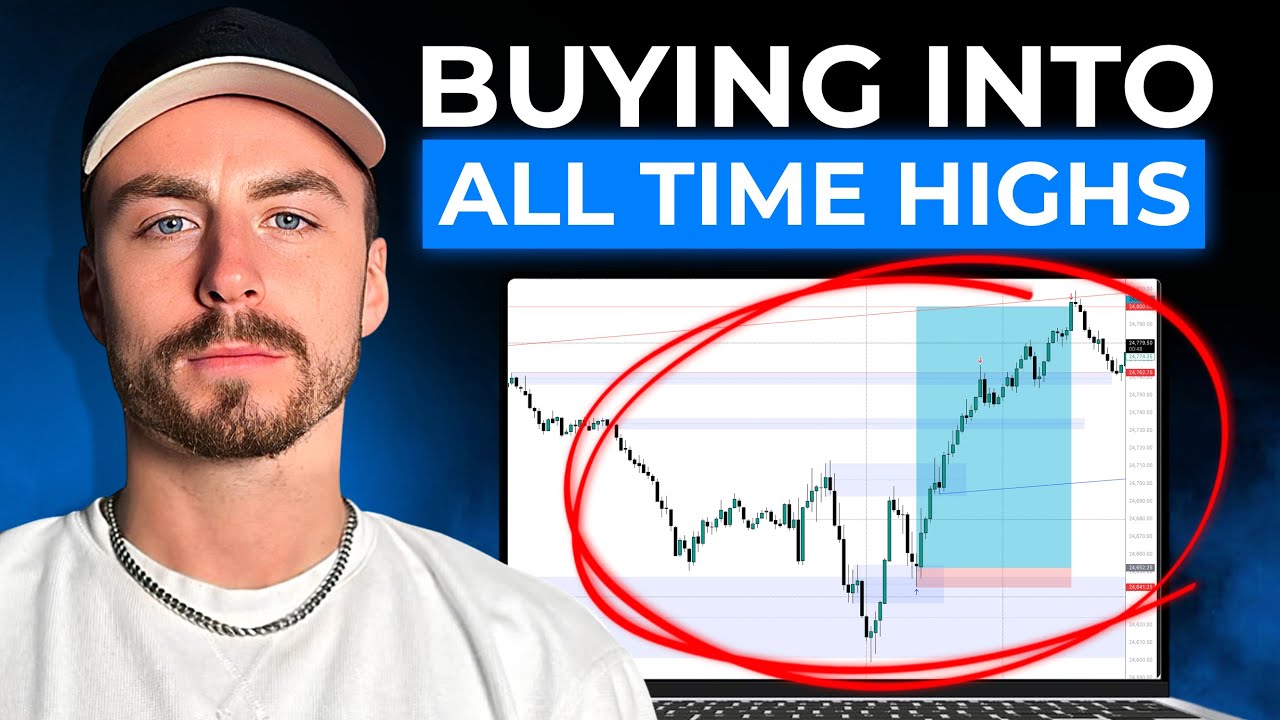
- 😀 Marking areas to avoid (red boxes) versus areas to trade (blue boxes) helps visualize optimal entries and exits.
- 😀 Patience is crucial: wait for liquidity to be cleared before entering a trade, rather than chasing premature moves.
- 😀 Understanding liquidity zones allows traders to anticipate market reactions and improve risk management.
- 😀 Regular practice and review of liquidity concepts gradually improves comprehension and trading accuracy.
Q & A
What is the main topic of this Interquity trading video?
-The main topic is liquidity in the market and how to identify and trade around liquidity zones effectively.
What does the video suggest about trading at highs and lows?
-The video emphasizes avoiding trading with liquidity at highs and lows. Traders should wait until liquidity has been taken out before entering trades.
What is a 'trap move' in the context of this video?
-A trap move occurs when the market briefly moves to take liquidity but does not complete the actual intended move, often tricking traders into entering prematurely.
How can traders identify where liquidity is located?
-Liquidity can be identified above previous highs or below previous lows, and it often becomes visible when the market respects those levels and moves away.
Why are some moves labeled with red boxes on the charts?
-Red boxes indicate areas where trades should be avoided because the market is still trading with liquidity and not yet in a confirmed move.
What do the blue boxes on the charts represent?
-Blue boxes indicate ideal trading zones where liquidity has been created and can be safely targeted for trades.
What is the significance of waiting for sellers or buyers to be taken out before trading?
-Waiting ensures that you are not trading with liquidity, reducing the risk of being trapped in false moves and increasing the probability of entering a successful trade.
Can you explain the concept of running liquidity?
-Running liquidity refers to the market moving to take out all stop-loss orders or pending positions in a liquidity zone, which then fuels a strong move in the intended direction.
Why are liquidity moves described as fast and precise?
-Liquidity moves are typically rapid because the market quickly grabs available liquidity, causing swift price action that experienced traders can exploit for profitable entries.
What is the recommended approach when price moves to a new high or low but hasn't taken liquidity yet?
-The recommended approach is to avoid trading until the liquidity has been fully taken out, as entering early could mean trading against other participants and losing potential profit.
How does the video suggest handling complex price action on lower time frames?
-The video advises zooming into lower time frames to identify liquidity zones more clearly, ensuring you only trade in confirmed areas rather than guessing based on partial price movements.
What are the key visual cues in the charts to help understand liquidity?
-Key visual cues include the marking of highs and lows, red boxes for areas to avoid, blue boxes for ideal trading zones, and observing price reactions around these levels to identify liquidity traps.
Outlines

Этот раздел доступен только подписчикам платных тарифов. Пожалуйста, перейдите на платный тариф для доступа.
Перейти на платный тарифMindmap

Этот раздел доступен только подписчикам платных тарифов. Пожалуйста, перейдите на платный тариф для доступа.
Перейти на платный тарифKeywords

Этот раздел доступен только подписчикам платных тарифов. Пожалуйста, перейдите на платный тариф для доступа.
Перейти на платный тарифHighlights

Этот раздел доступен только подписчикам платных тарифов. Пожалуйста, перейдите на платный тариф для доступа.
Перейти на платный тарифTranscripts

Этот раздел доступен только подписчикам платных тарифов. Пожалуйста, перейдите на платный тариф для доступа.
Перейти на платный тарифПосмотреть больше похожих видео


5.0 / 5 (0 votes)
