Understanding Chi-Square and Fisher's Exact Tests
Summary
TLDRThis video explains the use of the chi-square and Fisher's exact tests in statistical analysis, focusing on when and how to apply them to assess the relationship between two proportions. The speaker highlights the importance of understanding the data and test mechanics, discussing how both tests compare observed frequencies with expected ones. With an example of cats learning to line dance, the video covers the calculation of expected values, chi-square formula application, and interpreting the results. The speaker emphasizes the need for context in data interpretation and warns against relying solely on p-values, urging viewers to consider sample size and effect size for reliable conclusions.
Takeaways
- 😀 Chi-square and Fisher's exact test are used to determine if there is a significant difference between two proportions, commonly in categorical data.
- 😀 Qualitative (categorical) variables, which are non-numeric, come in three types: nominal, ordinal, and binary.
- 😀 The chi-square test is easier to calculate manually but gives only an approximation of significance, while the Fisher's exact test provides an exact p-value, especially accurate for small samples.
- 😀 Fisher's exact test is more reliable for small sample sizes, while the chi-square test is more suitable for large sample sizes due to its approximation nature.
- 😀 The chi-square test compares observed frequencies with expected ones to assess if the observed difference is significant or due to chance.
- 😀 The chi-square formula involves calculating the difference between observed and expected values, and the larger the difference, the more likely it is significant.
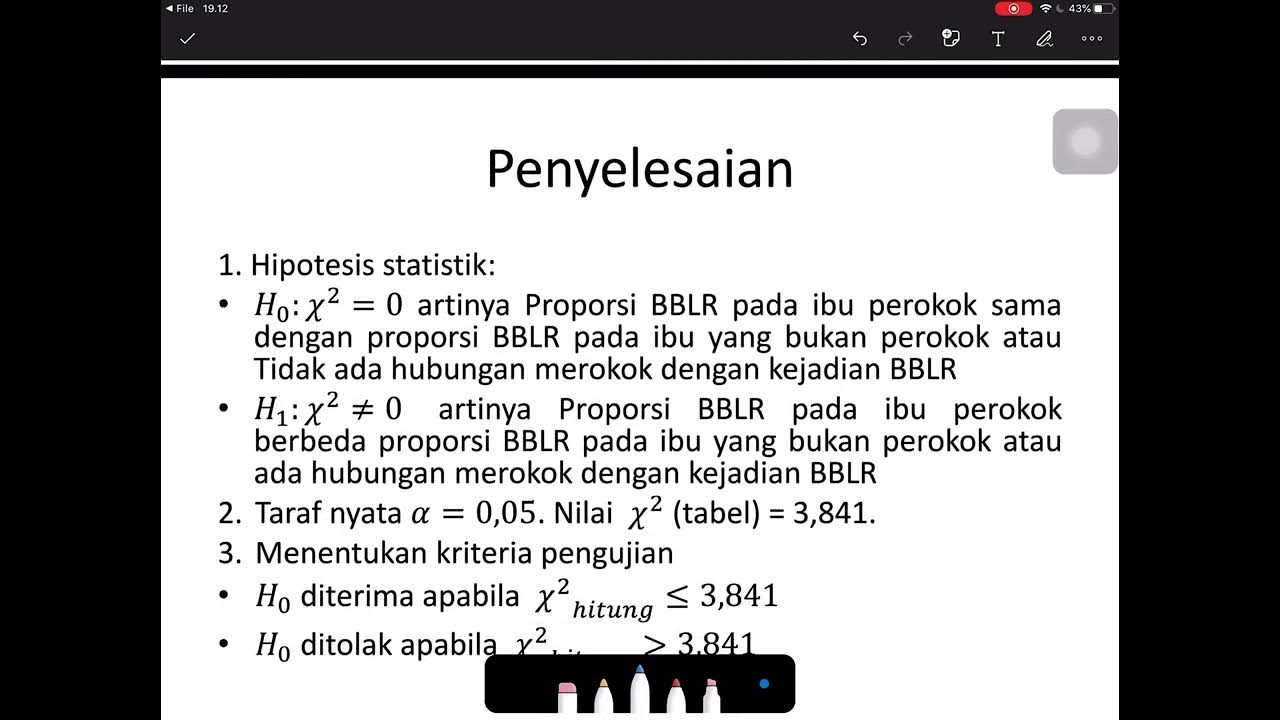
- 😀 The chi-square statistic needs to be compared to a critical value from the chi-square table to determine significance, with a typical significance level of 0.05.
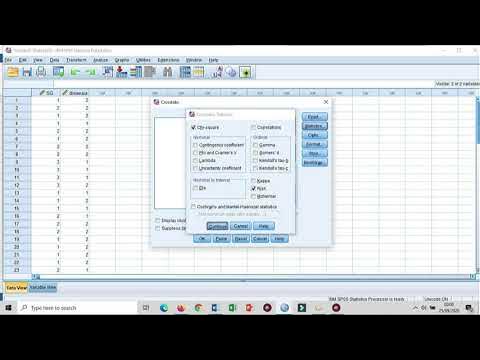
- 😀 With software like Prism, calculating chi-square and Fisher's exact test becomes more intuitive, especially for larger contingency tables.
- 😀 It's crucial to perform statistical tests on actual counts rather than percentages to avoid distorting the sample size and p-value accuracy.
- 😀 Significance in data analysis is not just about p-values but should also consider effect size, sample size, and the context of the experiment for reliable results.
Q & A
What is the main purpose of using the Chi-square and Fisher's exact tests?
-The main purpose of using the Chi-square and Fisher's exact tests is to determine if there is a significant difference between two proportions, such as whether a relationship exists between two categorical variables.
What is the difference between a qualitative variable and a quantitative variable?
-A qualitative variable refers to data that is categorical, such as categories or types (e.g., genotype, species), whereas a quantitative variable is numerical and represents quantities or measurements (e.g., height, weight).
How do the Chi-square and Fisher's exact tests differ in terms of computation and application?
-The Chi-square test is easier to calculate by hand and is suitable for larger sample sizes, while the Fisher's exact test is more accurate for smaller sample sizes, offering an exact p-value. The Chi-square test provides an approximation.
What are the expected frequencies in the context of the Chi-square test?
-The expected frequencies in a Chi-square test are the counts of occurrences that would be expected if there were no relationship between the variables. These are compared with the observed frequencies to assess the significance of the results.
What is the formula for calculating the expected frequency in a Chi-square test?
-The expected frequency is calculated as (row total × column total) / grand total. This calculation estimates how many observations would be expected under the assumption of no relationship between the variables.
What are the two approaches to calculating the expected frequencies in the provided example?
-The two approaches are the direct count approach, which applies the Chi-square formula directly, and the probability approach, which calculates the probability of the two independent events happening together and multiplies these probabilities.
Why is it important to run statistical tests on actual counts rather than percentages?
-It is important to run tests on actual counts rather than percentages because percentages can artificially inflate or deflate sample sizes, leading to inaccurate p-values and misleading conclusions.
What role does the sample size play in interpreting p-values in statistical tests?
-Sample size plays a crucial role in the reliability of the p-value. A larger sample size tends to provide more reliable results, while smaller sample sizes may result in less confidence in the findings.
How do you interpret a p-value in the context of the Chi-square test?
-A p-value indicates the probability that the observed differences are due to chance. If the p-value is lower than a predetermined significance level (e.g., 0.05), the results are considered statistically significant, suggesting a relationship between the variables.
What is the odds ratio, and how is it relevant to the Chi-square test?
-The odds ratio is a measure of association between two groups. In the context of the Chi-square test, it compares the odds of an event occurring in one group relative to the odds in another group, providing additional insight into the strength of the relationship between variables.
Outlines

Этот раздел доступен только подписчикам платных тарифов. Пожалуйста, перейдите на платный тариф для доступа.
Перейти на платный тарифMindmap

Этот раздел доступен только подписчикам платных тарифов. Пожалуйста, перейдите на платный тариф для доступа.
Перейти на платный тарифKeywords

Этот раздел доступен только подписчикам платных тарифов. Пожалуйста, перейдите на платный тариф для доступа.
Перейти на платный тарифHighlights

Этот раздел доступен только подписчикам платных тарифов. Пожалуйста, перейдите на платный тариф для доступа.
Перейти на платный тарифTranscripts

Этот раздел доступен только подписчикам платных тарифов. Пожалуйста, перейдите на платный тариф для доступа.
Перейти на платный тарифПосмотреть больше похожих видео

MATERI UJI CHI SQUARE DAN FISHER EXACT (UJI BEDA PROPORSI)

SYARAT MENGGUNAKAN UJI CHI SQUARE DAN FISHER EXACT

Uji Prasyarat Analisis Data | Statistika Pendidikan
mencari uji alternatif setelah uji chi square dengan tabel lebih dari 2x2 tidak memenuhi syarat
Uji Chi Square (Contoh soal dan penyelesaian)

The Secret Weapons of Research: Statistical Tools Revealed
5.0 / 5 (0 votes)
