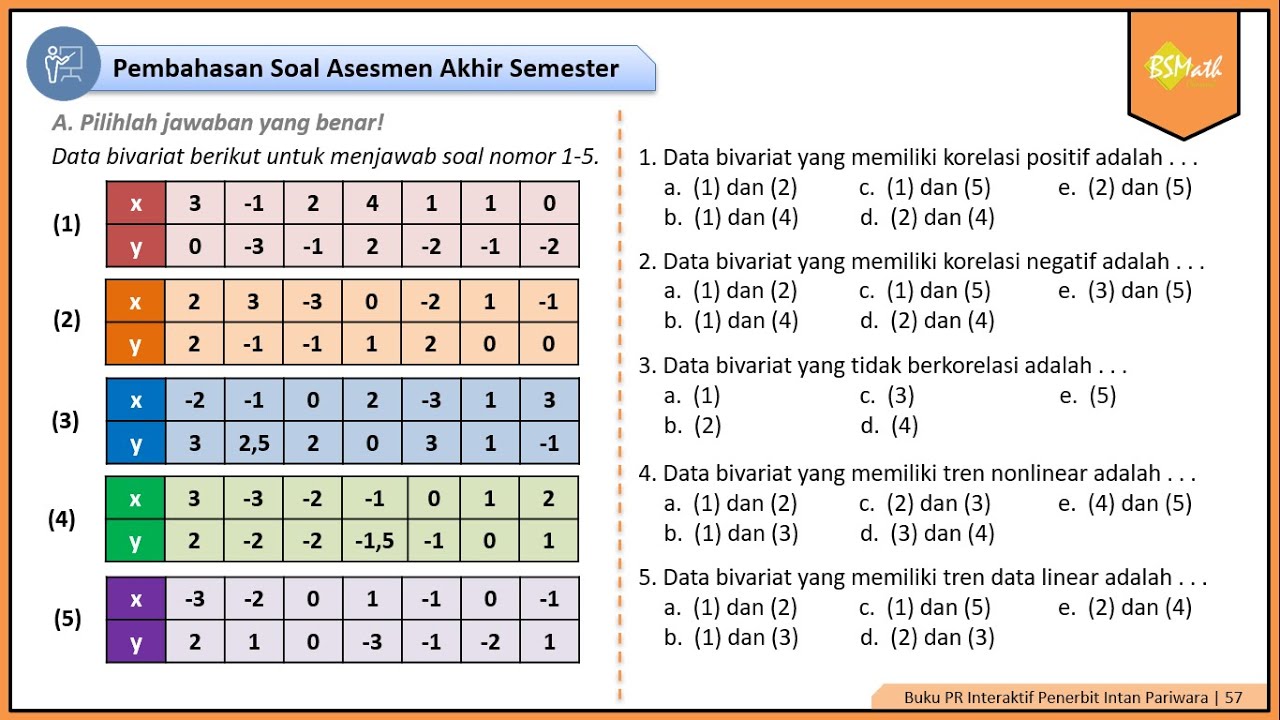
ASESMEN TENGAH SEMESTER PILGAN NO.1-10 HAL.21-23 MAT.WAJIB KLS 11B DIAGRAM PENCAR PR INTAN PARIWARA
Summary
TLDRIn this educational video, the teacher guides 11th-grade students through solving multiple-choice questions on bivariate data, focusing on the factors that influence rainfall. Key concepts discussed include independent and dependent variables, positive and negative correlations, as well as linear and nonlinear trends. The teacher uses real-life examples and diagrams to explain how variables such as altitude, proximity to the equator, and distance from the sea impact rainfall. The video aims to help students understand how to identify and interpret correlations from both written passages and graphical data, promoting better comprehension of statistical relationships.
Takeaways
- 😀 The lesson focuses on understanding scatter plots and how various factors affect rainfall, such as altitude, distance from the equator, and proximity to the sea.
- 😀 Positive correlations between variables include wind, which increases rainfall, and the proximity to the equator, which also increases rainfall.
- 😀 Negative correlations are observed with factors like the distance from the sea, where greater distance leads to lower rainfall, and higher altitudes leading to less rainfall.
- 😀 The teacher explains that a variable that affects another is called an independent (free) variable, while the variable being affected is the dependent variable (rainfall in this case).
- 😀 The script emphasizes understanding the relationship between variables and how to identify these relationships in data through scatter plots.
- 😀 A positive correlation in scatter plots is represented by a trend from the lower left to the upper right, indicating an increase in one variable as the other increases.
- 😀 A negative correlation shows an opposite trend, from the upper left to the lower right, where one variable decreases as the other increases.
- 😀 In a scatter plot, if data points don’t form a clear pattern, the variables are considered to have no correlation.
- 😀 Non-linear trends in scatter plots are characterized by curved lines, whereas linear trends are represented by straight lines, showing direct proportionality.
- 😀 The lesson involves practical examples from the textbook, using bivariate data sets to reinforce how to identify positive, negative, and no correlation in real data.
Q & A
What is the main focus of the script?
-The main focus of the script is to guide students through solving multiple-choice questions related to scatter plots and correlations, based on a reading about factors affecting rainfall.
What does 'variabel bebas' (independent variable) refer to in the context of the script?
-'Variabel bebas' refers to the independent variable, which influences or affects the dependent variable ('variabel terikat'). It is the factor that is manipulated or changes to observe its impact on the dependent variable.
How does the script explain the relationship between altitude and rainfall?
-The script explains that higher altitude generally leads to lower rainfall, indicating a negative correlation between altitude and rainfall.
What does a positive correlation between two variables mean?
-A positive correlation means that as one variable increases, the other also increases. In the script, this is shown when an increase in certain factors, like wind, leads to an increase in rainfall.
Which pair of variables from the script has a positive correlation?
-The pair 'the amount of wind passing through an area' and 'rainfall' has a positive correlation, as an increase in wind leads to more rainfall.
What is the definition of a negative correlation according to the script?
-A negative correlation occurs when one variable increases while the other decreases. For example, the script shows that as the distance from the ocean increases, rainfall tends to decrease.
Which pair of variables from the script has a negative correlation?
-The pair 'distance from the ocean' and 'rainfall' has a negative correlation, as greater distances from the ocean result in lower rainfall.
What is meant by 'non-linear trends' in data, as discussed in the script?
-Non-linear trends refer to data that do not follow a straight-line pattern. In the script, this is illustrated by data that forms curved patterns in the scatter plot, indicating a non-linear relationship.
Which diagram in the script represents a linear trend?
-Diagrams 1 and 2 represent a linear trend, where the data points follow a straight line, indicating a linear correlation between the variables.
How does the script explain the concept of 'bivariat data'?
-The script defines 'bivariat data' as data involving two variables, where the relationship between them is analyzed through scatter plots and correlations. This helps in understanding how one variable may affect the other.
Outlines

Этот раздел доступен только подписчикам платных тарифов. Пожалуйста, перейдите на платный тариф для доступа.
Перейти на платный тарифMindmap

Этот раздел доступен только подписчикам платных тарифов. Пожалуйста, перейдите на платный тариф для доступа.
Перейти на платный тарифKeywords

Этот раздел доступен только подписчикам платных тарифов. Пожалуйста, перейдите на платный тариф для доступа.
Перейти на платный тарифHighlights

Этот раздел доступен только подписчикам платных тарифов. Пожалуйста, перейдите на платный тариф для доступа.
Перейти на платный тарифTranscripts

Этот раздел доступен только подписчикам платных тарифов. Пожалуйста, перейдите на платный тариф для доступа.
Перейти на платный тарифПосмотреть больше похожих видео
Pembahasan Soal Asesmen Akhir Semester Materi Diagram Pencar Nomor 1-5 | Matematika Wajib Kelas XI

Pemantapan PTS Genap Kelas XI Part 1 | Kimia SMA | Tetty Afianti

[Part 1] Menggali Nilai Sejarah Bangsa Lewat Cerita Pendek #kelas11 #sma #smkbisa #kurikulummerdeka

Hubungan Diagram Pencar dan Korelasi Variabel X dan Y

11.SINIF EDEBİYAT 2.DÖNEM 2.YAZILIYA HAZIRLIK GENEL TEKRAR KONU ANLATIMI | 2024- 2025📂2.SENARYO🔥
Latihan Soal Pola Bilangan
5.0 / 5 (0 votes)
