ROE DuPont Analysis - How to Use the DuPont Equation to Analyze a Stock - DuPont Decomposition
Summary
TLDRThis video explains Return on Equity (ROE) and how it can be analyzed using the DuPont analysis. ROE measures a company's profitability based on shareholder equity, showing how much profit is generated for each dollar of equity. The DuPont analysis breaks down ROE into components like profit margin, asset turnover, and financial leverage to reveal how these factors contribute to ROE. It also explores how ROE can be impacted by taxes, interest, and operating efficiency, and warns against relying on high ROE caused by increased financial leverage.
Takeaways
- 📊 Return on Equity (ROE) is a ratio that shows how much profit a company generates for each dollar of equity, ignoring the stock price.
- 🔍 The DuPont analysis breaks down ROE into three components: profit margins, leverage, and turnover, offering deeper insight into how ROE is generated.
- 🧮 ROE is calculated by dividing net income by equity, revealing the profit generated per dollar of equity.
- 📈 A 25% ROE means the company generates 25 cents in profit for every $1 of equity.
- 💡 The DuPont formula breaks ROE into net profit margin (net income/revenue), equity turnover (revenue/average equity), and leverage (assets/equity).
- 🏦 Asset turnover measures how effectively management uses assets to generate revenue, while leverage shows the company’s debt level.
- 📉 Deeper decomposition of the DuPont equation includes tax burden, interest burden, and operating margin for more granular insight into ROE.
- 🔄 Comparing ROE over time or with competitors helps identify why ROE changes, e.g., the decline in ROE from 101% in 2015 to 32% in 2017.
- ⚖️ Higher financial leverage can increase ROE by reducing equity, but it may signal risk if leverage is too high.
- 📉 Falling ROE can result from factors like worsening operating margin, declining asset turnover, or increased tax burden, as seen in the 2015-2017 example.
Q & A
What is Return on Equity (ROE) and what does it indicate?
-Return on Equity (ROE) measures how much profit a company generates for each dollar of equity. For example, an ROE of 25% means the company generates 25 cents in profit for every dollar of equity.
What is the basic formula for calculating ROE?
-The basic formula for ROE is net income divided by equity. This gives an overall indication of how well a company is utilizing its equity to generate profit.
What is the purpose of the DuPont analysis in relation to ROE?
-The DuPont analysis breaks down ROE into different components such as profit margins, leverage, and turnover. This helps in understanding how ROE is generated and offers more detailed insights into a company’s performance.
How is equity turnover calculated, and what does it tell us?
-Equity turnover is calculated by dividing revenue by the average total equity. It shows how much revenue the company's equity is able to generate over the course of a year.
Why do we use average equity instead of just equity in the ROE calculation?
-Average equity is used because net income is earned over the entire year, while equity is a snapshot at a specific point in time. Using averages makes the numbers more comparable.
How does the DuPont formula break down ROE into further components?
-The DuPont formula can be further broken down into net profit margin, asset turnover, and leverage ratio. These components help in understanding the sources of ROE more clearly.
What additional insights can be gained by breaking down the net profit margin?
-The net profit margin can be further deconstructed into tax burden, interest burden, and operating margin. This allows for a more detailed analysis of how taxes, interest expenses, and operating efficiency contribute to the overall ROE.
Why can higher financial leverage increase ROE, and why should it be monitored carefully?
-Higher financial leverage can increase ROE because it reduces the equity portion, making ROE appear higher. However, this can be a red flag as it may indicate higher levels of debt, which could pose risks to the company’s financial health.
What are the potential reasons for a decline in ROE over time?
-A decline in ROE can result from factors such as a worsening tax burden, declining interest efficiency, lower operating margins, or reduced asset turnover. These components indicate that the company may be facing challenges in maintaining profitability and efficiency.
How can the DuPont analysis be useful when comparing companies in the same industry?
-The DuPont analysis allows for a detailed comparison of how different companies generate their ROE. By breaking down the components of ROE, you can identify why one company’s ROE is higher or lower than another, providing deeper insights into their financial performance.
Outlines

Этот раздел доступен только подписчикам платных тарифов. Пожалуйста, перейдите на платный тариф для доступа.
Перейти на платный тарифMindmap

Этот раздел доступен только подписчикам платных тарифов. Пожалуйста, перейдите на платный тариф для доступа.
Перейти на платный тарифKeywords

Этот раздел доступен только подписчикам платных тарифов. Пожалуйста, перейдите на платный тариф для доступа.
Перейти на платный тарифHighlights

Этот раздел доступен только подписчикам платных тарифов. Пожалуйста, перейдите на платный тариф для доступа.
Перейти на платный тарифTranscripts

Этот раздел доступен только подписчикам платных тарифов. Пожалуйста, перейдите на платный тариф для доступа.
Перейти на платный тариф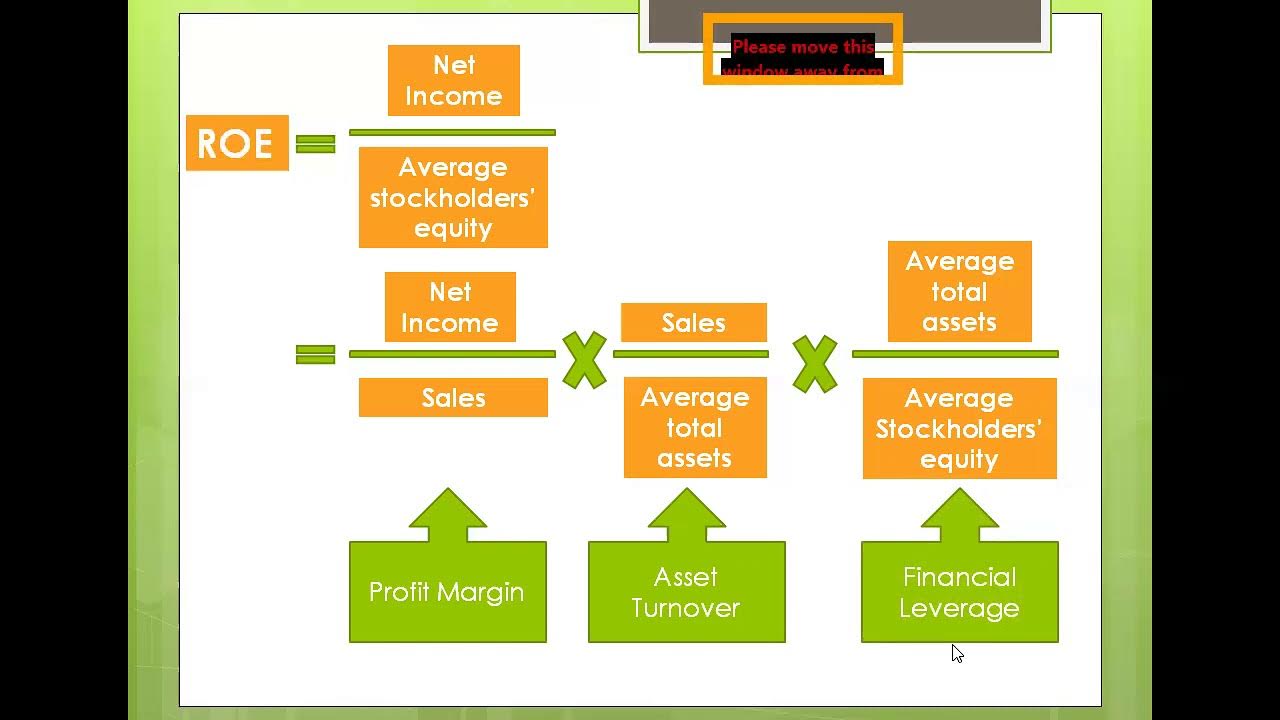


5.0 / 5 (0 votes)
