如何用Python對美股自動量化交易, 實戰一個簡單的日內自動交易程序

大數據Trader
11 Mar 202212:36

Summary

TLDRThis video tutorial demonstrates how to automate stock trading using Python with the Interactive Brokers platform. It covers configuring the IB client, acquiring real-time stock data, and implementing a trading bot for intraday strategies. The strategy uses the Hammer candlestick pattern as a signal for entering trades. The presenter also explains how to connect to a free API for real-time stock data, write custom code for pattern recognition, and automate buy/sell actions using market orders. This approach helps automate trading, saving time for users by eliminating manual monitoring of stock charts.

Takeaways

  • 💻 The video discusses using Python to connect to Interactive Brokers for automated trading.
  • 🔗 The presenter introduces a case study on integrating Python with Interactive Brokers for intraday quantitative trading.
  • 🕒 Quantitative trading can help amateur investors who cannot monitor the market all day due to other commitments.
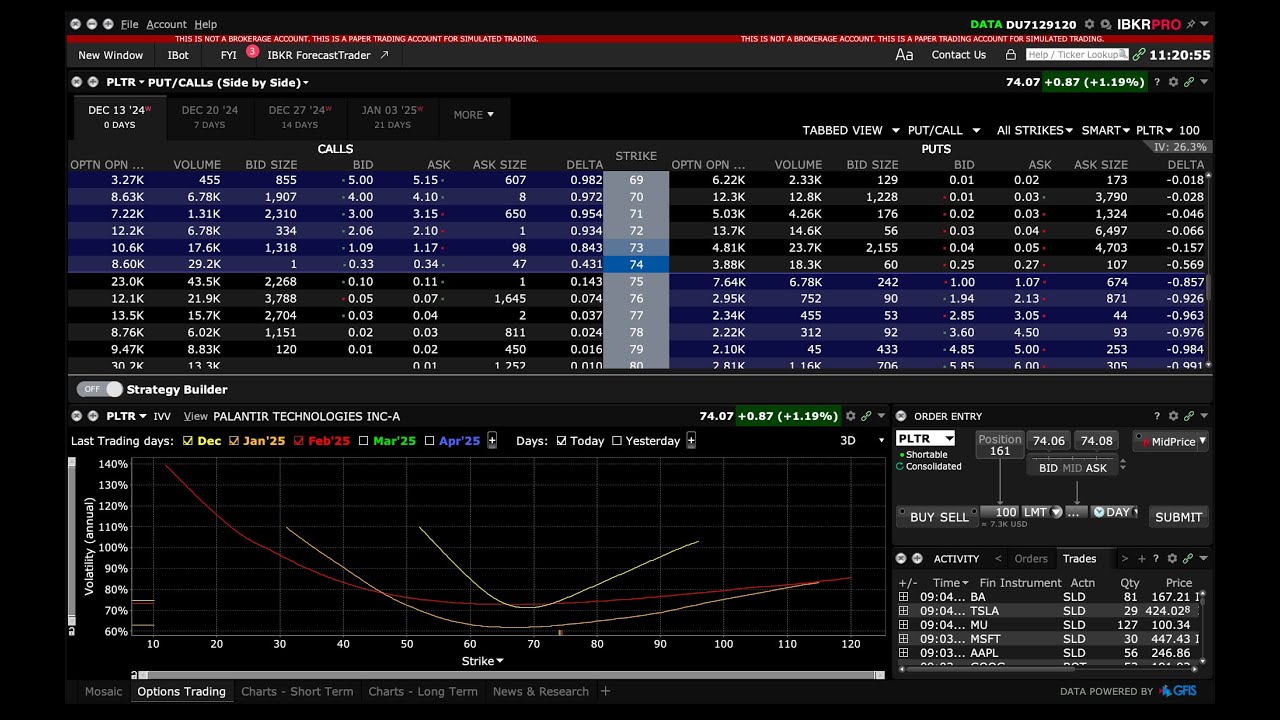
  • 📈 The video explains how to use Python to automate trading by connecting to the Interactive Brokers' Trader Workstation (TWS).
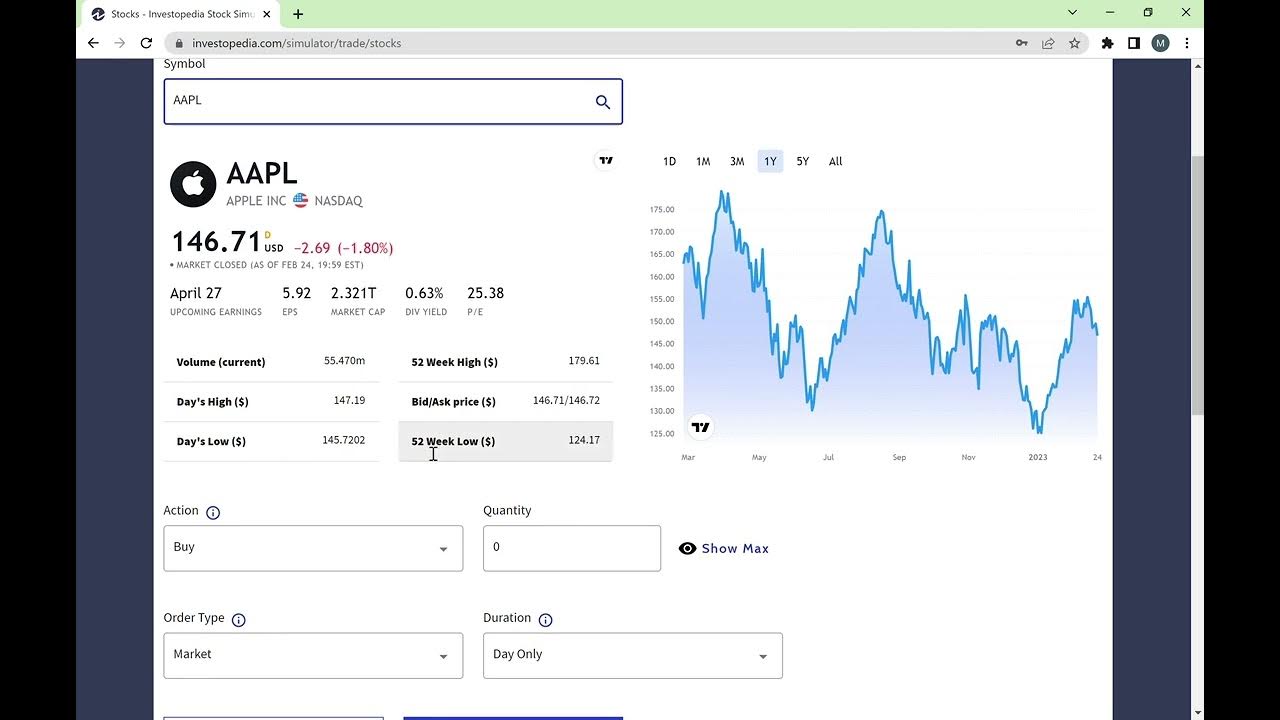
  • 📊 The presenter uses a free stock data app called Fineharb.io to obtain real-time stock data for quantitative analysis.
  • 📈 The script outlines how to use the Fineharb.io API to fetch real-time stock data using Python.
  • 📋 The strategy discussed is based on candlestick patterns, specifically the 'hammer' pattern, which signals a potential reversal and upward trend.
  • 📈 The hammer pattern is identified by a specific candlestick shape that indicates a strong buying interest after a period of selling.
  • 💡 The presenter shares a strategy learned from an Indian trader, focusing on the 'hammer' pattern within a downtrend as a bullish signal.
  • 🔧 The video includes a detailed walkthrough of the Python code required to implement the trading strategy using the hammer pattern.
  • 🔄 The script describes setting up a loop in the Python code to continuously check for the hammer pattern and execute trades accordingly.
  • 📉 The strategy includes setting stop-loss and take-profit levels to manage risk and lock in profits during automated trading.

Q & A

  • What is the main focus of the video script?

    -The main focus of the video script is to demonstrate how to use Python to connect to Interactive Brokers (IB) for automatic trading, specifically for intraday quantitative trading of US stocks.

  • Why is it beneficial to use a quantitative trading robot?

    -A quantitative trading robot is beneficial because it can monitor the market and automatically execute trades on behalf of the investor, ensuring that they do not miss out on trading opportunities due to being occupied with other tasks such as work.

  • What is the role of the 'Trader Workstation' mentioned in the script?

    -The 'Trader Workstation' is a client software from Interactive Brokers that is used to connect to their trading system. It is necessary for the Python scripts to interact with the trading platform.

  • How does one obtain real-time market data for quantitative trading as described in the script?

    -The script suggests using a free API from a platform called 'fineharb.io' that provides one-minute US stock data. This data is used to monitor market conditions for trading strategies.

  • What is the significance of the 'hammer' candlestick pattern in the trading strategy discussed?

    -The 'hammer' candlestick pattern is significant as it indicates a potential reversal and upward trend in the market. It is used as a trading signal to initiate long positions when it appears during a downtrend.

  • How does the script suggest to handle the execution of trades?

    -The script suggests using the Interactive Brokers' API to execute trades. It involves writing a Python script that connects to the trading platform, retrieves real-time data, and places trades based on the defined strategy.

  • What is the purpose of setting stop-loss and take-profit orders in the trading strategy?

    -The purpose of setting stop-loss and take-profit orders is to automate the process of closing positions to lock in profits or limit losses once the trade reaches a predetermined price level.

  • How often does the trading script check for new trading signals?

    -The script checks for new trading signals every ten seconds, as indicated by the 'tm.sleep(10)' command in the script.

  • What is the significance of the 'hammerbulish' indicator mentioned in the script?

    -The 'hammerbulish' indicator is a custom indicator used in the script to identify 'hammer' candlestick patterns, specifically during downtrends, to determine potential reversal points for initiating trades.

  • Can the trading strategy discussed in the script be applied to other financial instruments besides US stocks?

    -Yes, the trading strategy can potentially be applied to other financial instruments such as forex, futures, and cryptocurrencies, as long as the necessary data and trading platform support are available.

  • What is the advantage of monitoring multiple stocks simultaneously as suggested in the script?

    -Monitoring multiple stocks simultaneously increases the chances of finding trading opportunities as the strategy can react to signals across various stocks, rather than focusing on a single stock.

Outlines

00:00

💻 Introduction to Automating Stock Trading with Python and Interactive Brokers

The speaker begins by introducing a previous video where they explained how to use Python to connect to Interactive Brokers (IB) for automated stock trading. Today’s video extends that concept by using a trading bot for day trading US stocks with real-time data. The speaker explains that as a part-time trader, it's challenging to monitor the stock market constantly due to work and other activities, leading to missed opportunities. Hence, automation is crucial. The speaker emphasizes the need to configure IB's Trader Workstation (TWS) and mentions using a free service, 'finnhub.io', for obtaining real-time US stock data, necessary for monitoring market conditions. After acquiring the data, the video proceeds with demonstrating the Python code to establish the connection and fetch real-time stock data for automated trading.

05:05

📊 Utilizing the Hammer Candlestick Pattern for Automated Trading

The speaker discusses the trading strategy used in the automated system, focusing on the Hammer candlestick pattern, which signals a potential market reversal. The speaker explains that when a hammer candlestick appears after a downtrend, it could indicate a bullish reversal. They walk through an example where the hammer shape helped predict an upward movement in the market. The Hammer pattern is characterized by a small body and a long lower shadow, which suggests buyers regained control after sellers initially pushed the price lower. The speaker further explains how this pattern can be utilized in intraday trading to automate buy signals, introducing the hammer bullish indicator, which is more reliable when it appears in a downtrend.

10:08

📈 Coding the Hammer Indicator for Reliable Trading Signals

Continuing from the previous segment, the speaker goes into detail about coding a custom hammer indicator. While Python’s 'pandas-ta' library has a built-in Hammer pattern detector, the speaker found it too simplistic for practical trading. Thus, they implemented a more robust version of the hammer bullish indicator. This custom solution checks for the presence of a downtrend and accurately identifies potential reversal signals. The speaker also walks through the logic of the code, explaining how they tailored it to fit real-world trading needs. By combining this with real-time market data and an automated trading bot, they demonstrate how the system generates buy signals when hammer patterns are detected.

🔄 Building the Automated Trading Loop and Executing Trades

The speaker introduces the final step in constructing the automated trading system, which revolves around creating a loop that continuously monitors the market and executes trades. The loop checks for hammer signals and retrieves the latest market data every 10 seconds. The real-time data is packaged into a pandas DataFrame for easy analysis, and if the latest data meets the hammer criteria, the system places a market order to buy stocks. The speaker emphasizes the importance of configuring the Interactive Brokers client properly and choosing the right stock (e.g., 'BRK.B') for the demo. They note that the system can be expanded to monitor multiple stocks simultaneously to maximize trading opportunities.

🚀 Setting Stop-Loss and Take-Profit Parameters in Automated Trading

After successfully executing a buy order, the speaker highlights the importance of defining exit points using stop-loss and take-profit limits. They demonstrate how to set these thresholds in the code, with stop-loss fixed at 0.33% and take-profit at 0.04%. Once these conditions are met, the trade exits automatically. The speaker emphasizes that this eliminates the need for constant monitoring, allowing traders to focus on other activities. They also discuss the potential for scaling the strategy to monitor numerous stocks simultaneously, automating trades whenever the system detects predefined signals, without needing to track individual stock fundamentals.

📊 Expanding Automation Beyond Stocks to Other Markets

In the final part of the video, the speaker explores the potential of expanding automated trading to other financial markets such as forex, futures, and cryptocurrencies. They mention that the strategy, while demonstrated with stocks, is versatile and can be applied to any asset class with available real-time data. The speaker wraps up by reiterating the convenience and efficiency of automated trading systems, allowing traders to save time while still capturing key market opportunities. They encourage viewers to explore other strategies beyond the hammer pattern and to like and subscribe for more content.

Mindmap

Keywords

💡Python

Python is a high-level programming language known for its readability and versatility. In the video, Python is used to create scripts that automate trading processes by connecting to brokerage platforms and executing trades based on predefined strategies. It's a key tool for the presenter's demonstration of automated trading.

💡Interactive Brokers (IB)

Interactive Brokers is a brokerage firm that provides electronic trading via its Trader Workstation (TWS) platform. The video discusses how to use Python to connect to Interactive Brokers for automated trading, emphasizing the need for proper configuration to enable this connection.

💡Automated Trading

Automated trading refers to the use of algorithms to place orders in the financial markets with minimal human intervention. The video focuses on creating an automated trading system that can monitor the market and execute trades without the need for constant human oversight.

💡Quantitative Trading

Quantitative trading, or 'quant' trading, involves using mathematical models to analyze market data and make trading decisions. The script describes how quant trading can be facilitated by Python scripts that automate the process of monitoring market conditions and executing trades based on specific criteria.

💡API

API stands for Application Programming Interface, a set of rules and protocols for building and interacting with software applications. The video script mentions using an API to connect to a free stock data platform, which provides the necessary market data for the trading algorithm.

💡Real-time Data

Real-time data refers to information that is delivered as it happens. In the context of the video, real-time data is crucial for the trading algorithm to monitor market conditions and react promptly to potential trading opportunities.

💡Candlestick Chart

A candlestick chart is a style of financial chart used to describe price movements of a security, derivative, or currency. The video discusses using candlestick patterns, specifically the 'hammer' pattern, as a signal for trading decisions within the automated strategy.

💡Hammer Pattern

The hammer pattern is a specific type of candlestick pattern that resembles a hammer. It is often interpreted as a bullish signal, suggesting that a price may reverse and move upward after a decline. The video script describes using this pattern as a trigger for buying in the automated trading strategy.

💡Pandas

Pandas is a Python library providing high-performance, easy-to-use data structures, and data analysis tools. In the video, Pandas is used to handle and analyze financial data, such as converting the data into a DataFrame for easier manipulation and analysis.

💡Market Order

A market order is an order to buy or sell a security immediately at the best available current price. The video script includes the use of market orders in the automated trading system to execute trades based on the trading signals generated by the algorithm.

💡Stop Loss

A stop loss is an order placed with a broker to sell a security when it reaches a certain price. The video discusses setting stop loss orders to limit potential losses in the automated trading system, which is essential for risk management.

Highlights

Introduction to using Python to connect to Interactive Brokers for automated trading.

Sharing a case study on integrating Passion with Interactive Brokers for intraday quantitative trading.

The importance of not missing trading opportunities due to other commitments.

How to set up the Interactive Brokers (IB) client for Python connection.

The necessity of real-time market data for quantitative trading.

Using a free app, Fineharb.io, to obtain minute-level stock data.

Demonstration of how to retrieve real-time market data using Python.

Explanation of parameters needed to fetch stock data, such as stock ticker, timeframe, and timestamps.

Conversion of retrieved data into a Pandas DataFrame for analysis.

Construction of a trading strategy using candlestick patterns.

Description of the 'hammer' candlestick pattern as a trading signal.

The concept of using 'hammerbulish' as an indicator for potential trend reversals.

Writing custom Python code to identify hammer patterns for trading signals.

Combining real-time data, trading strategy, and Interactive Brokers client for automated trading.

Explanation of the loop in the trading program that checks for trading signals every ten seconds.

How to handle buy orders when a hammer signal is detected.

Setting stop-loss and take-profit orders after a successful trade.

The benefit of letting the automated trading program run while you are resting or busy.

Potential for scaling the strategy to monitor multiple stocks or different markets.

Encouragement to like and subscribe for more content.

Transcripts

play00:06

大家好

play00:07

之前我讲过一期视频 教大家如何用Python连接到营透证券 实现自动下单 自动交易

play00:15

今天进一步给大家分享一下用passion对接到营透证券的案例

play00:21

我们将通过拍展进行每股日内量化交易实战 很多时候 作为量化的业余投资者Python整天盯盘

play00:31

我们要上班 我们要做其他的事情 那很有可能就会错过掉一些黄金的入场时机

play00:38

错过掉交易机会 所以这需要有量化机器人帮我们做这些事情

play00:44

帮我们盯盘 帮我们自动下单 下面我就通过一个简单的日内交易策略来对美股进行全自动交易

play00:54

首先 我们要打开py charm 然后还要打开我们的t ws

play01:02

也就是这个chadworkstation 这个是银套的客户端

play01:07

我们要通过这个客户端才可以连接到银透的交易系统 当然 连接之前我们要稍微配置一下银透的这个客户端

play01:17

才可以用python连接到这个客户端上 具体配置我就不在这里过多的讲解了

play01:23

不懂的朋友可以看我之前的那个教学视频 下面直接看到程序代码 我们第一步要用拍摄连接到营透

play01:33

获取到客户端对象 这个很简单 就两行代码就可以搞定 另一方面 我们要进行量化交易

play01:41

还有一个非常重要的事情就是 必须得有市场的实时数据才能让我们的程序监控到当前的行情状况

play01:51

迎透 他是不提供免费的数据 要付费才能获取到数据权限

play01:57

这里我是网上找了一个免费的每股数据app 可以免费获取到每股一分钟的数据平台 叫做

play02:08

fineharb点io 只要注册一个账号就可以获取到他的app

play02:13

然后就可以免费获取到每股一分钟的实时数据 我们可以调用

play02:20

这平台的拍摄模块 然后获取到实时的数据 回到代码 我们看看如何获取到实时行情数据的

play02:30

首先 同样地 我们需要实力化一个客户端 这也直接传入这个app进去就可以了 然后我们拿到

play02:37

这个finghub的客户端对象就可以去请求数据了 请求的数据代码是在这一段

play02:46

通过这个客户端调用stalk kindle这个函数就可以获取到

play02:52

一段时期内的行情数据 首先我们看常入哪些参数 第一个是cb 就是股票的标号

play03:01

然后是timfriend 比如如果你要选择30分钟k线的话 所以就填个30

play03:09

然后这个是一段时间范围内的k线 所以这个参数是初始的时间搓 然后这个是截止的时间搓

play03:17

我这个截止时间戳就是用的当前最新的时间戳 然后这个fromtimes在某用的是

play03:23

当前时间搓往前面推 三天的时间搓好了 有了这几个参数 就可以获取到一段时间范围的

play03:32

行情数据给大家通过这个ipad来演示一下 比如我们要获取苹果股票15分钟k线

play03:41

从这个时间戳到这个时间戳 这段时间范围内的行情数据

play03:49

看一下他 这里返回的是一个dict 是一个字典

play03:55

我们可以直接将这个字典转换成pandasheddeadfriend 很方便的可以转换

play04:03

直接调用tate frame 然后把这个date传进来 就可以拿到这个tate fram了 它的字段就是这些

play04:11

c h l o s tv这些都是比较标准的航天数据的字段和格式

play04:20

ok 既然我们都能获取到实时的行情数据 并且也有了交易所的拍审客户端对象

play04:27

那么就可以构造交易策略了 从而编写我们自动的交易程序 下面介绍下这个策略

play04:34

这个策略是我从一个印度老哥那里学到的 他的思路就是通过

play04:41

蜡烛形态作为交易触发的信号所用到的蜡烛形态是hammer锤子

play04:48

什么是hammer呢 简而言之就是一根梯形状的k线 当出现这种形态的k线时候 它有一定反转上升的趋势

play04:58

能从确定密度里面去观察一下 比如这个地方出现了一次这个k线

play05:04

那么后续的行情 它很有可能就是往上走的 再往前面看一下 有没有其他的hammer

play05:15

比如这个hammer 也可以看到 当出现这种梯形的形态的时候

play05:20

他们后市可能会有一波往上走的趋势 这个也是 其实这个也是一根很典型的hammer

play05:28

因为这个k线出现就是意味着多空双方交战激烈 并且最后

play05:34

是由多方占据了主导的位置 开始时候是在这里 期间一度的在价格的下方不断的徘徊 我们可以看到它这个下影线还是蛮长的

play05:46

最后多军又攻上来了 保住了在上方的价格 所以我们可以利用hammer形态的特性运用到日内交易

play05:55

当出现hammerk线的时候 我们就下篮做多 并且设定一定的指因止损

play06:02

这里我用的是这个指标 对应的是hammerboolish这个指标 它不但会判断k线的形态是hammer形态

play06:13

而且它是要在下行的趋势中的hammer才可以试作为玻璃水hammer

play06:20

可以看到 他这里有一个下行趋势的判断条件 因为hammer本来就应该作为下行趋势逆转的转折点

play06:29

也就是说 当熊市出现的一个hammer 那他就很有可能会转变成牛市

play06:37

好 我们继续回到代码中 我这里是制定写了一个hammer的判断指标

play06:43

啊还是代码量有点多的 有十几20行代码 虽然啊这个panda

play06:51

他自带有hammer的指标 但是我试了一下发现拍的贴这个hammer判断

play06:58

太过于简陋了 用在实战上是没有什么意义 其实它也就是调用贴力的

play07:07

贴力不的那个hammer判断还是得自己定义写一个hammer的判断

play07:13

于是我留在确定玉上 根据这个hammerbulish指标的逻辑 用passion也完全的实现了一遍

play07:23

好 现在万事具备 只欠东风 我们的交易信号指标的拍摄代码有了

play07:29

实时行情数据api也有了 连接交易所的客户端也有了 那就可以拼凑一个自动交易程序了

play07:38

拼凑也很简单啊 直接都在一个外循环里面实现啊 下面就一行一行的给大家解析一下

play07:49

循环里的每一行代码 第一个tm电视lip就是每隔十秒钟休息一下 然后再进行下一下一轮的循环

play07:59

就是获取行情数据的代码 这个刚才我也解释过了 所以就不解释然后获取到

play08:06

行情数据 我会把它包装成一个dateferpandas的datefriend 然后把它字段名字也改一下

play08:14

然后增加一个day time的字段 当最就是调用my ham这个函数

play08:22

来计算出我们所需要的hammer这一列字段作为交易信号的判断

play08:29

它是一个不我类型的啊 我这里还在运行 先暂停一下 给大家看一下

play08:35

这一列就是一个不额类型的啊 我把它叫做hammer 当初现去的时候 那么它就是有

play08:43

有买路的交易信号 那么我们就要去下班做多 所以我们通过对偏的是一些操作来获取到啊 最新的hammer之段 最新的price之段

play08:57

因为它是一个啊 按照时间顺序的带着负担 我们获取的最后一行 也就是

play09:04

当前最新的行情数据 ok 如果laticehammer就是最后这一行的

play09:11

这个hammer自断为去的话 那就是要买路做多 首先我们是要调用

play09:20

ib营透的客户端来获取到这个stalk 这是single啊 我这也是选择对

play09:30

b里b里这个股票进行买入的 当然你也可以换成其他的标号标的

play09:38

其实更好的方法是你对好几个股票 多只股票进行同时的监控

play09:44

有些策略 他是对所有的股票进行监控的 因为他不管你股票 他不管你是什么股票 只要找到了

play09:52

你交易信号的这种情况 他就可以下单 这样你的交易机会就会大很多很多

play10:00

接下来是order 这是一个marketo的市场价 以市场价进行买入

play10:08

好 然后调用这个配置o的就是进行了交易 完成交易之后

play10:13

就是买入成功了 我们就要设置他的出厂或他的出厂价位

play10:19

出场有两种情况 一种是指赢 还一种是止损 这个stoplimit就是指赢了

play10:28

啊 这是止损掉了止损我这里是设置一个

play10:33

固定的止盈止损点位这个stop老师 我目前是设置成0 33

play10:40

还有takeprof也是指盈 指盈 是设置的0 04就是分之四

play10:46

作为出场指盈的点位设置完之后 我们看得到 下班之后他会在这个银透中断里面生成

play10:59

一个order啊是它是一个厘米的order是设定好指定的价格 直接等待就好

play11:06

可以了 所以这里的话我们不用去做其他的操作了 因为报价好厘米的o的营透证券会把我们自动去交易

play11:15

我们再跑一下看一下 所以有了这个交易程序 可以在我们睡觉的时候自动打开这个交易程序 帮我们去蹲入场时机

play11:25

这样可以省去很多看盘的时间 毕竟盯盘是挺累的 我们可以把这些事情交给交际机器人去做 就把我们自己解放出来 可以去看电视啊 看看新闻等等

play11:41

其实还有一种玩法 就是我刚刚提到的 大规模的对所有的股票进行监控 我不care是哪一只股票

play11:49

我完全不用关心这股票基本面的事情 只要某个股票出现了我指定的交易信号

play11:55

就立马对这个标的进行交易 这种玩法肯定是人工玩不下来的

play12:03

因为一个人不可能同时订着几万只股票k线 对吧 这必须得用自动交易程序去做

play12:10

当然 这交易信号肯定也不止我今天所说的这个hammer形态 其实还有其他很多很多

play12:17

不同的策略玩法交易的市场也不局限于股票 还可以有外汇

play12:24

期货 加密 货币市场等等都可以用这种方法去做 量化实现自动交易好 今天市面就到这里

play12:33

记得点赞关注哈 谢谢各位观看

Rate This

5.0 / 5 (0 votes)

Связанные теги
Automated TradingPython CodingMarket DataQuant TradingStock SignalsInvestment TipsTechnical AnalysisFinancial StrategyHammer PatternIB API
Вам нужно краткое изложение на английском?