Introduction to infrared spectroscopy | Spectroscopy | Organic chemistry | Khan Academy
Summary
TLDRThis script explains the concept of molecular vibrations using infrared (IR) spectroscopy. It likens molecular bonds to springs, demonstrating how they stretch and contract when energy from IR light is absorbed. The script delves into how these vibrations appear on an IR spectrum, with a focus on transmittance and wave numbers. It distinguishes between the diagnostic region, useful for identifying functional groups, and the fingerprint region, unique to each molecule. The aim is to help viewers understand the structure of molecules through IR spectroscopy.
Takeaways
- 🌐 Infrared light can be absorbed by molecules, causing bonds to stretch, a phenomenon known as stretching vibration.
- 🔗 The stretching vibration of a chemical bond is analogous to the oscillation of a spring, with the bond modeled as such for simplicity.
- 📊 An infrared (IR) spectrum is used to identify which frequencies are absorbed by a compound, indicating the presence of specific bonds.
- 📉 A frequency with 100 percent transmittance on an IR spectrum means no absorption occurred, suggesting that frequency is not relevant to the compound's bonds.
- 📈 Conversely, less than 100 percent transmittance indicates that some light was absorbed, corresponding to a stretching vibration of a bond.
- 🔢 Wave number, measured in reciprocal centimeters, is defined as one over the wavelength of light and is used to analyze IR spectra.
- 🔄 The relationship between wave number, wavelength, and frequency is fundamental, with frequency being directly proportional to wave number.
- 🔍 The diagnostic region of an IR spectrum is useful for identifying functional groups in a molecule, as different groups absorb different frequencies.
- 👁🗨 The fingerprint region of the IR spectrum is more complex and unique to each molecule, serving as a molecular identifier.
- 🔬 Understanding the location, intensity, and shape of signals in the IR spectrum is crucial for analyzing and identifying molecular structures.
Q & A
What happens when infrared light is shone on a molecule?
-When infrared light is shone on a molecule, it's possible for the molecule to absorb energy from the light, which can cause a bond to stretch, a process known as a stretching vibration.
How is the stretching vibration of a bond compared to a spring?
-The stretching vibration of a bond is compared to the oscillation of a spring, where the bond can be thought of as a spring with two masses (atoms) on either end that can stretch and contract when energy is applied.
What is the significance of the bond between carbon and hydrogen in the context of the video?
-In the video, the bond between carbon and hydrogen is used as an example to model the concept of a bond as a spring, illustrating how energy can cause this bond to stretch and oscillate.
How does the infrared spectrum help in identifying molecular structures?
-The infrared spectrum helps in identifying molecular structures by showing which frequencies of light are absorbed by a compound. These absorptions correspond to specific bond vibrations, which can indicate the presence of certain functional groups.
What is the meaning of 'percent transmittance' in the context of an infrared spectrum?
-In the context of an infrared spectrum, 'percent transmittance' refers to the percentage of light that passes through a sample without being absorbed. A transmittance of 100% means no absorption occurred at that frequency.
How is wave number defined and how does it relate to the frequency of light?
-Wave number is defined as one over the wavelength in centimeters. It is inversely proportional to the wavelength and directly proportional to the frequency of light, as shown by the relationship: frequency = wave number × speed of light.
What is the diagnostic region in an infrared spectrum and why is it important?
-The diagnostic region in an infrared spectrum is the left side of the spectrum, typically below 1,500 wave numbers. It is important because signals in this region can be diagnostic for certain functional groups, helping to identify the structure of the molecule.
What is the fingerprint region in an infrared spectrum and how does it differ from the diagnostic region?
-The fingerprint region is the right side of the infrared spectrum, above 1,500 wave numbers. It is more complex and harder to interpret than the diagnostic region, but it is unique to each molecule, acting like a molecular fingerprint for identification purposes.
Why is the location of a signal in an infrared spectrum significant?
-The location of a signal in an infrared spectrum is significant because it corresponds to a specific wave number, which can be used to identify the type of bond or functional group that is absorbing the energy.
What additional aspects of a signal in an infrared spectrum, besides location, are important to consider?
-Besides the location, the intensity and shape of a signal in an infrared spectrum are also important. These can provide further information about the strength of the bond vibrations and the complexity of the molecular structure.
Outlines

Этот раздел доступен только подписчикам платных тарифов. Пожалуйста, перейдите на платный тариф для доступа.
Перейти на платный тарифMindmap

Этот раздел доступен только подписчикам платных тарифов. Пожалуйста, перейдите на платный тариф для доступа.
Перейти на платный тарифKeywords

Этот раздел доступен только подписчикам платных тарифов. Пожалуйста, перейдите на платный тариф для доступа.
Перейти на платный тарифHighlights

Этот раздел доступен только подписчикам платных тарифов. Пожалуйста, перейдите на платный тариф для доступа.
Перейти на платный тарифTranscripts

Этот раздел доступен только подписчикам платных тарифов. Пожалуйста, перейдите на платный тариф для доступа.
Перейти на платный тарифПосмотреть больше похожих видео

(16) IR Spectroscopy | Introduction to Infrared (IR) Spectroscopy | Instrumental Method of Analysis

Infrared Spectroscopy - Part 1 By Dr. Smriti Dwivedi | AKTU Digital Education

Bonds as springs | Spectroscopy | Organic chemistry | Khan Academy

IR Spectroscopy
IR Spectroscopy and Mass Spectrometry: Crash Course Organic Chemistry #5
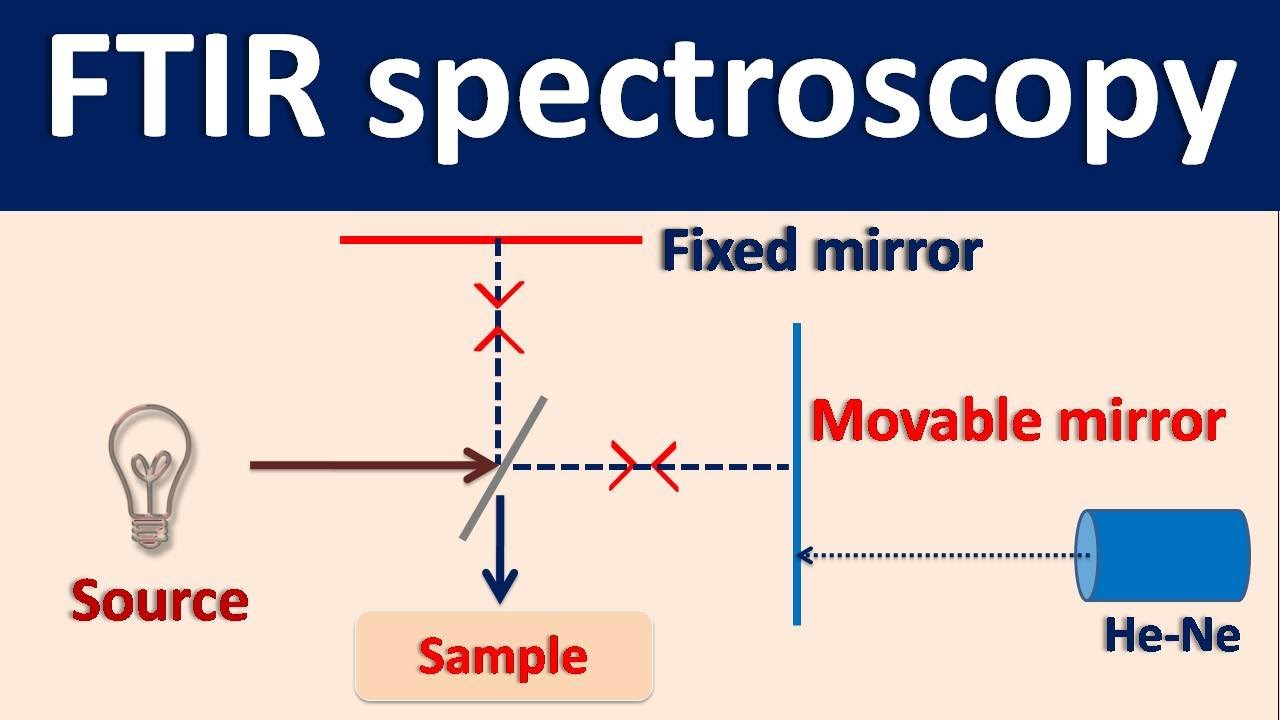
Fourier Transform IR spectroscopy (FTIR) - How it works?
5.0 / 5 (0 votes)
