ICT Mentorship Core Content - Month 1 - Equilibrium Vs. Premium
Summary
TLDRこのビデオスクリプトでは、株式市場でのプレミアム価格とイクイリブリアム価格の概念を比較分析しています。トレーダーは、価格のインパルススイングを探し、それをもとに大きなスイングを定義し、その範囲内で売買の戦略を立てます。フェイボナッチ回帰レベルを使って、62%から79%のリトレースメントレベルで売りエントリーの最適ポイントを見つけ、利益をとるポイントはスイングローの下方に設定することが推奨されています。デイリーチャートや時間単位のチャートにかかわらず、これらの戦略は市場のトレンドやコンソリデーションにかかわらず適用可能です。
Takeaways
- 📈 脚本は、ICTメンターシップの9月のセッション5で、エクイリブリアムとプレミアムを比較するトピックに焦点を当てています。
- 🔄 「エクイリブリアム対ディスカウント」の内容に基づいて、価格アクションにおいてエクイリブリアムとプレミアムは対照的な概念であると説明されています。
- 🏹 プレミアム市場を探査する際には、インパルス価格スイング(価格の急激な変動)を探し、それを大きなインパルススイングの一部として分析することが重要です。
- 📊 フィボナッチ回帰線は、価格範囲を定義するのに役立ち、特に高いポイントから価格の低いポイントへの引け目として使用されます。
- 🛑 オプティマルトレードエントリーポイントとして、フィボナッチの62%から79%のリトレースメントレベルが推奨されています。
- 🔄 市場がエクイリブリアム(50%のリトレースメントレベル)を超過し始めると、プレミアム市場に入ると判断され、売りの機会が提供されます。
- 📉 市場がエクイリブリアムを超過し、62%または79%のリトレースメントレベルに達すると、売りのシグナルが強化され、利益をとるためのポテンシャルが高まります。
- 💰 利益は、市場がスイングローから下落した際に取得され、利益確定ポイントは市場の古い低ポイントまたは新しい低ポイントの下に設定することが推奨されています。
- 📊 トレーダーは、価格スイングを測定し、それを使用して、エクイリブリアムとプレミアムのレベルを特定する必要があります。
- 🚫 トレーディングではバイアスを持ちません。市場が上昇、コンシリデーション、または反転しているかにかかわらず、レンジトレーディングの概念は同じです。
- 👨🏫 トレーディングの教訓は、新しいトレーダーにとって理解するのが難しいかもしれませんが、プロのトレーダーとしてこれらの概念を適用することは重要です。
Q & A
「プレミアム市場」と「イクイリブリアム市場」の違いは何ですか?
-「プレミアム市場」とは、現在の取引範囲において非常に高価な価格レベルに達している市場であり、「イクイリブリアム市場」とは、価格がその範囲の半分(50%)のレベルに達した状態を指します。
「インパルス価格スイング」とは何を意味していますか?
-「インパルス価格スイング」とは、価格の急激な動きを指し、これは通常、大きな価格変動を表すために使用されます。
Fibonacciレトロスペクションレベルとは何ですか?どのようにトレードに役立つか?
-Fibonacciレトロスペクションレベルは、価格が過去の高値から低値へのスイングの特定の割合に戻るレベルを示す指標であり、トレーダーはこれらを使用してエントリーポイントやターゲットレベルを判断します。
「オプティマルトレードエントリー」とは何を意味していますか?
-「オプティマルトレードエントリー」とは、Fibonacciの62%から79%のレベルで売買を行うことを意味しており、市場が非常に超買(または超売)の状態にあると予想されるレベルです。
「タートルスープ」とは何を意味していますか?
-「タートルスープ」とは、市場が旧高を超えたときに売り信号を出すトレード戦略であり、これはターゲットとして旧低を設定します。
価格が「イクイリブリアム」を超えた場合、なぜ売りのチャンスがあるとみなされますか?
-価格が「イクイリブリアム」を超えると、市場はその範囲のプレミアムレベルに入るため、超買状態にあり、売出のチャンスが高くなると考えられます。
スイングローが形成されると、なぜトレーダーはその4本目のキャンドルに注目しますか?
-スイングローが形成されると、トレーダーは4本目のキャンドルに注目して、価格が高くなる意思があるかどうかを判断します。これは、価格が次の動きに向かっていることを示す可能性があるからです。
価格が「プレミアム」レベルに達した場合、なぜトレーダーは売り入れるべきですか?
-価格が「プレミアム」レベルに達した場合、市場はその範囲で非常に高価であり、売りのチャンスが高くなると考えられます。これは、市場が過度に高騰しているため、売出が適切な戦略になる可能性があるからです。
トレーディングの範囲を定義する際に、価格スイングを使用する理由は何ですか?
-価格スイングを使用してトレーディングの範囲を定義することで、価格の動きをより明確に把握し、買いや売りのエントリーポイントやターゲットをより正確に判断できます。
デイトレーダーではない場合でも、デイリーチャートを使用してトレードすることの利点は何ですか?
-デイリーチャートを使用することで、トレーダーはより広い時間枠で市場の動きを分析し、必要な大きな価格変動を捕捉することができます。これは、短期的なチャートよりも多くのパイプを獲得する可能性があります。
Outlines

このセクションは有料ユーザー限定です。 アクセスするには、アップグレードをお願いします。
今すぐアップグレードMindmap

このセクションは有料ユーザー限定です。 アクセスするには、アップグレードをお願いします。
今すぐアップグレードKeywords

このセクションは有料ユーザー限定です。 アクセスするには、アップグレードをお願いします。
今すぐアップグレードHighlights

このセクションは有料ユーザー限定です。 アクセスするには、アップグレードをお願いします。
今すぐアップグレードTranscripts

このセクションは有料ユーザー限定です。 アクセスするには、アップグレードをお願いします。
今すぐアップグレード関連動画をさらに表示

NEW Price Action Concepts Indicator by LuxAlgo (Full Overview)

【急騰的中】さあ、ここからが本番だ。バブルの波をうまく乗りこなせ!【上級テクニック】

あの大増配が公言された世界首位級の有名高配当株が下げ続けています
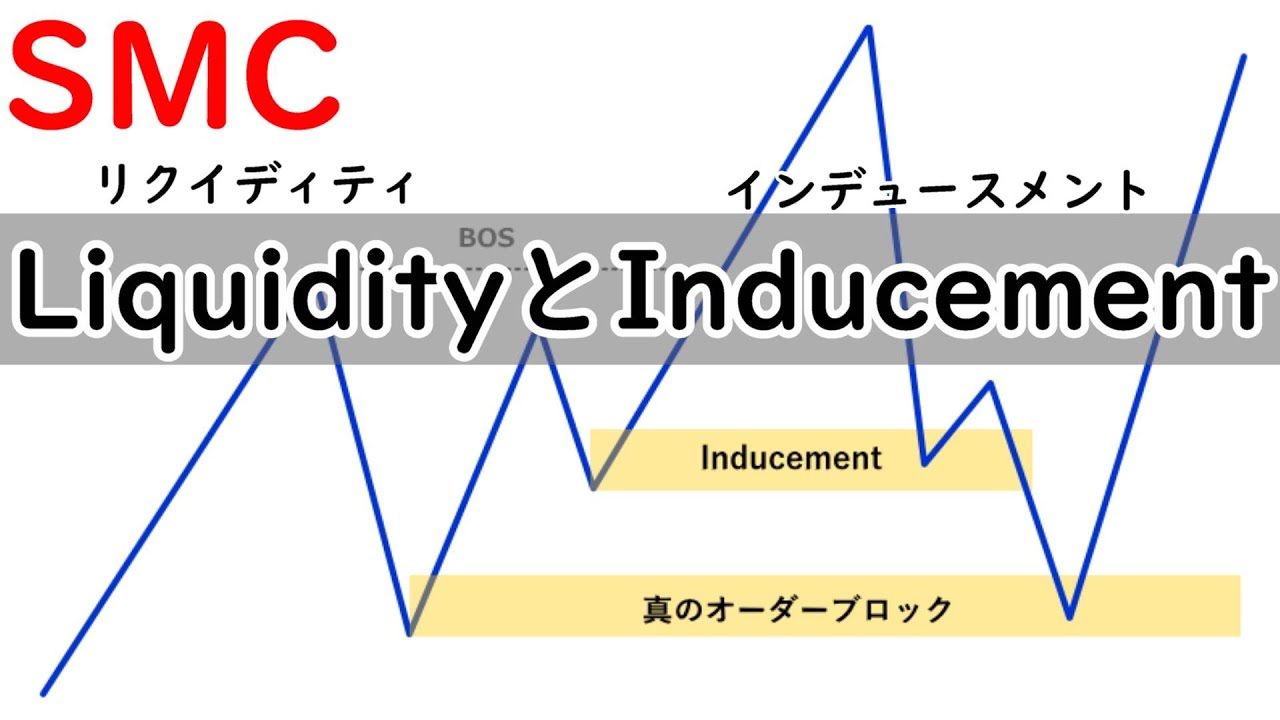
【SMC】LiquidityとInducementの解説

【Gクラス】 G450d/G580発表の影響は?!今の最新相場動向についてお話しします!

岡崎良介 【4万円台回復のメカニズム】|3月22日までの上昇と今回の上昇は意味が違う|マーケット自身のプライスメカニズム|やはりスピード違反 罰金は払った|今週のNEWS】2024年7月6日

Used Motorcycle Prices – A Statistical Analysis
5.0 / 5 (0 votes)