Saya Backtest EMA 200 dan MACD Strategi (Ini Hasilnya)
Summary
TLDRIn this video, the presenter demonstrates a practical method for testing trading indicators using a $5,000 virtual account. Focusing on MACD and the 200-period Exponential Moving Average (EMA), they explain how to identify buy and sell signals, set stop-losses, and calculate risk-reward ratios. Using Google Sheets for automated tracking of wins, losses, and balances, the session emphasizes manual backtesting from January 2009 to highlight win rates and overall system performance. Key insights include the importance of risk and money management, recognizing market trends, and understanding that consistent evaluation can help traders make informed decisions without risking real money.
Takeaways
- 😀 The video demonstrates how to test trading indicators like MACD and EMA using a $5,000 capital to evaluate win rates and profitability.
- 😀 The risk-reward strategy used is 1:2, meaning for every $100 risk, the target profit is $200. This helps maintain consistency and balance in trades.
- 😀 MACD is an indicator used to identify buy or sell signals based on crossovers of the MACD line and the signal line, providing actionable trade entries.
- 😀 EMA (Exponential Moving Average) is used to determine market trends. A price above the EMA indicates a bullish trend (buy), and below it signals a bearish trend (sell).
- 😀 The backtesting was done manually on TradingView, simulating real market conditions without risking actual money, ensuring a real-world perspective on the system's effectiveness.
- 😀 The win rate after 50 trades is 40%, meaning 20 wins and 30 losses, showing that even with a low win rate, the system can still be profitable.
- 😀 From a starting balance of $5,000, the account grew to $6,000 after 50 trades, illustrating that proper risk management can generate returns despite occasional losses.
- 😀 The importance of stop-loss strategy was emphasized, with the stop-loss being set at the previous high for sell trades or the previous low for buy trades, offering a clear risk control method.
- 😀 Manual trading is preferred over automated systems as it allows traders to have a better grasp of market dynamics and react to conditions more effectively.
- 😀 Consistent risk management is critical—when the trader's risk exposure is too high, even small losses can wipe out gains, which makes controlling lot sizes essential.
- 😀 The system is viable for steady returns, with the potential for a 20% gain on the initial capital after one month if traded twice a day with proper discipline and strategy.
Q & A
What is the main purpose of the video?
-The video aims to demonstrate how to test trading indicators and systems, specifically focusing on the MACD and Moving Average, to assess their effectiveness in a trading strategy.
What trading system is being tested in the video?
-The system being tested involves a combination of the MACD (Moving Average Convergence Divergence) and the EMA (Exponential Moving Average). The test uses a $5,000 initial capital with a risk-to-reward ratio of 1:2.
How does the trading formula work in the test?
-The formula automatically calculates the win and loss percentages based on the results of each trade. When a trade is won, $200 is added to the balance, and when lost, $100 is deducted. The system tracks the number of wins, losses, and overall balance automatically.
What risk management strategy is used in the trading test?
-The risk management strategy used is a 2% risk per trade. This means that each trade risks 2% of the $5,000, which amounts to $100 per trade.
What is the role of the EMA 200 in the trading system?
-The EMA 200 is used to determine the overall market trend. If the price is above the EMA 200, it indicates a bullish trend, and if the price is below, it indicates a bearish trend. This helps in deciding whether to look for buy or sell opportunities.
How does the MACD indicator contribute to the trading strategy?
-The MACD indicator helps identify buy or sell signals through its crossover points. A crossover above the signal line indicates a buy signal, and a crossover below it signals a sell opportunity. This is used alongside the EMA to confirm the trend direction.
What happens when the market shows a MACD crossover but is above the EMA?
-When the MACD shows a sell signal but the price is above the EMA, the strategy suggests ignoring the sell signal and continuing to look for buy opportunities, as the overall trend remains bullish.
What was the win rate of the trading system after 50 trades?
-The win rate of the trading system after 50 trades was 40%. This means that out of 50 trades, 20 were successful, and 30 were losses.
What did the trader notice about the market behavior during the test?
-The trader noticed that when the MACD line was wide apart, the system tended to be more profitable. However, when the MACD lines were close together or flat, there were more losses, highlighting the importance of market conditions in trading.
How did the trader's balance change after 50 trades?
-After 50 trades, the trader's initial balance of $5,000 grew to $6,000, representing a 20% profit. The trader observed that the system provided stable returns without significant fluctuations, making it a viable strategy for consistent gains.
Outlines

このセクションは有料ユーザー限定です。 アクセスするには、アップグレードをお願いします。
今すぐアップグレードMindmap

このセクションは有料ユーザー限定です。 アクセスするには、アップグレードをお願いします。
今すぐアップグレードKeywords

このセクションは有料ユーザー限定です。 アクセスするには、アップグレードをお願いします。
今すぐアップグレードHighlights

このセクションは有料ユーザー限定です。 アクセスするには、アップグレードをお願いします。
今すぐアップグレードTranscripts

このセクションは有料ユーザー限定です。 アクセスするには、アップグレードをお願いします。
今すぐアップグレード関連動画をさらに表示

Quick & Easy Django Deployment on PythonAnywhere (Full Guide)

Cara Scalping di Broker HFM Terbaru 2026 | Strategi & Setting Akun Terbaik
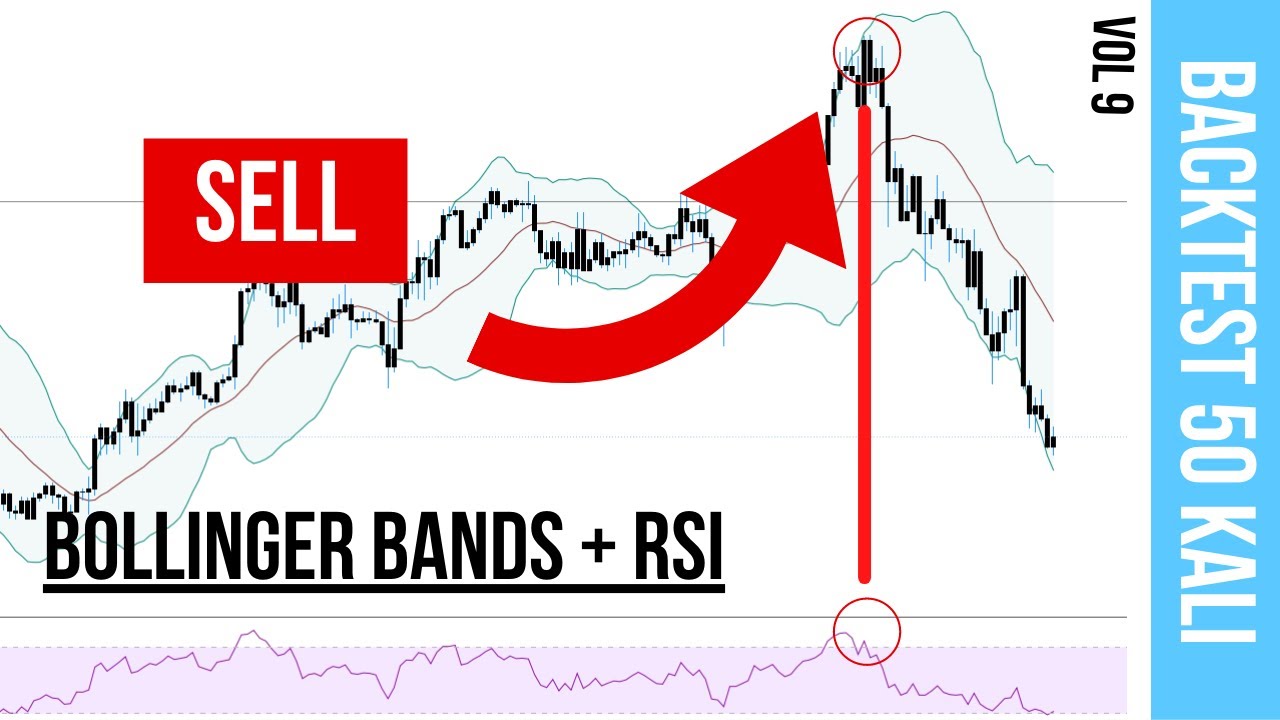
Saya backtest Bollinger bands + RSI (Ini hasilnya)

NEW Chat GPT-4 Trading Strategy Turned $100 to $7313!

From 50$ to 20,000$+ NO-RISK method | Pocket Option Trading Strategy | Binary options trading
V5 | Backtesting
5.0 / 5 (0 votes)
