Top 3 FREE TradingView BuySell Indicators RANKED (With Proof!)
Summary
TLDRThis video reveals the top three free buy and sell indicators on TradingView that can improve your trading results. The host presents powerful tools like the Two-Pole Oscillator and Zero Lag Trend Signals, showing how they identify buy and sell signals with minimal noise, eliminate false signals, and enhance risk management. By combining indicators like MACD, ATR, and custom strategy builders, traders can craft personalized strategies with high success rates. With detailed entry and exit strategies, this video offers a comprehensive guide to mastering these indicators and improving trading performance.
Takeaways
- 📈 There are thousands of trading indicators on TradingView, but most are ineffective and can harm your account.
- 🆓 The top-ranked indicators in this video are free, eliminating the need for expensive premium tools.
- 🔵 The Two-Pole Oscillator by Big Beluga identifies momentum, trend strength, and trade signals with minimal noise.
- 📊 Combining the Two-Pole Oscillator with the Volumeatic Variable Index Dynamic Average (VIDO) improves trend confirmation using delta volume.
- ⏱️ Proper timing is crucial: for the Two-Pole Oscillator, enter trades after the close of the second candle to avoid premature entries.
- ⚡ The Zero Lag Trend Signals indicator by Algo Alpha eliminates lag and false signals, showing trend reversals and pullback opportunities across multiple timeframes.
- 📉 Using the Momentum Bias Index alongside Zero Lag Trend Signals helps confirm strong bullish or bearish momentum for more reliable trade entries.
- 🛠️ The DIY Custom Strategy Builder by ZPY allows combining over 40 indicators into a single customizable strategy for leading and confirmation signals.
- 🎨 Visual enhancements like colored candles, dashboards, and supply/demand zones improve trade analysis and help identify high-confidence signals.
- 🛡️ Risk management is emphasized throughout: use invalidation levels, swing highs/lows, and maintain a minimum 1.5×–2× risk-reward ratio for take-profit targets.
- ⏳ Signal expiry and confirmation windows are essential settings in custom strategies to filter weak or misaligned setups.
- 📌 Consistency in strategy execution, proper context analysis, and leveraging visual cues significantly enhance trading performance.
Q & A
What is the Two-Pole Oscillator and why is it recommended?
-The Two-Pole Oscillator by Big Beluga is a momentum and trend-strength indicator that provides buy and sell signals with minimal noise. It uses color-coded oscillator lines and invalidation levels for proper risk management, helping traders identify overbought and oversold conditions effectively.
How does the Two-Pole Oscillator generate buy and sell signals?
-Buy signals are generated when the oscillator crosses above the signal line and appear as blue upward arrows. Sell signals occur when the oscillator crosses below the signal line, marked with downward arrows. Invalidation levels indicate when a trade is no longer valid, acting as stop-loss points.
What is the role of the Volumeatic Variable Index Dynamic Average (VIDEo) when used with the Two-Pole Oscillator?
-The VIDEo indicator confirms trend strength by showing bullish or bearish trends with a green or red ribbon. Delta volume must reach at least 20% to validate a trade, ensuring that the market has enough momentum to support the signal.
What makes the Zero Lag Trend Signals indicator effective?
-Zero Lag Trend Signals, by Algo Alpha, eliminates false signals using ATR and zero-lag technology. It provides trend ribbons, reversal arrows, and multi-time frame confirmation, helping traders execute trend reversal and pullback strategies with higher accuracy.
How should traders use multi-time frame confirmation with Zero Lag Trend Signals?
-Traders should confirm that the trend direction aligns across multiple time frames (5 min, 15 min, 1 hour, 4 hour, daily) before entering a trade. This reduces false entries and increases the probability of success.
What is the purpose of the Momentum Bias Index in conjunction with Zero Lag Trend Signals?
-The Momentum Bias Index validates the strength of bullish or bearish momentum. Bright green or red histogram bars above thresholds confirm strong market bias, ensuring trades are only taken when momentum is significant.
What is the DIY Custom Strategy Builder and why is it considered the ultimate tool?
-The DIY Custom Strategy Builder by ZPY integrates over 40 indicators into one customizable platform. It allows traders to select primary and confirmation indicators, automatically generates signals, and provides visual aids like candle coloring, supply and demand zones, and a dashboard for real-time confirmation.
How does signal expiry work in the DIY Custom Strategy Builder?
-Signal expiry sets a window (default three candles) for confirmation indicators to align with the primary signal. If the confirmation conditions are not met within this window, no signal is printed, helping filter out weak or delayed trade setups.
What are the recommended trade management strategies described in the video?
-Traders should place stop-losses just below swing lows or invalidation levels for long positions, and above swing highs for short positions. Take-profit targets are suggested at 1.5–2× risk, and moving stop-loss to break-even at a 1:1 movement helps protect capital while allowing profits to run.
How can traders customize their strategies using the DIY Custom Strategy Builder?
-Traders can select different leading and confirmation indicators from a library of over 40 tools, adjust parameters like EMA length or MACD conditions, toggle visual elements like supply and demand zones, and modify signal expiry and switchboard settings to match their preferred trading style and market conditions.
Why is visual confirmation, such as candle color and supply/demand zones, important when trading with these indicators?
-Visual confirmations provide immediate context for market momentum and potential support/resistance levels. Green candles reinforce bullish signals, red candles reinforce bearish signals, and zones help identify where institutional traders might act, increasing confidence in trade entries.
What is the recommended approach to avoid false or weak trade signals?
-Traders should rely on multi-indicator confirmation, validate signals with multi-time frame analysis, check momentum strength using supporting indicators, and consider market context through supply/demand zones and candle colors to reduce false or weak entries.
Outlines

このセクションは有料ユーザー限定です。 アクセスするには、アップグレードをお願いします。
今すぐアップグレードMindmap

このセクションは有料ユーザー限定です。 アクセスするには、アップグレードをお願いします。
今すぐアップグレードKeywords

このセクションは有料ユーザー限定です。 アクセスするには、アップグレードをお願いします。
今すぐアップグレードHighlights

このセクションは有料ユーザー限定です。 アクセスするには、アップグレードをお願いします。
今すぐアップグレードTranscripts

このセクションは有料ユーザー限定です。 アクセスするには、アップグレードをお願いします。
今すぐアップグレード関連動画をさらに表示

2025 FRESH MACD Buy and Sell 1 minute Scalping | Buy and Sell Indicator

Strategi Scalping Gold M5 Menggunakan RSI Dan Moving Average
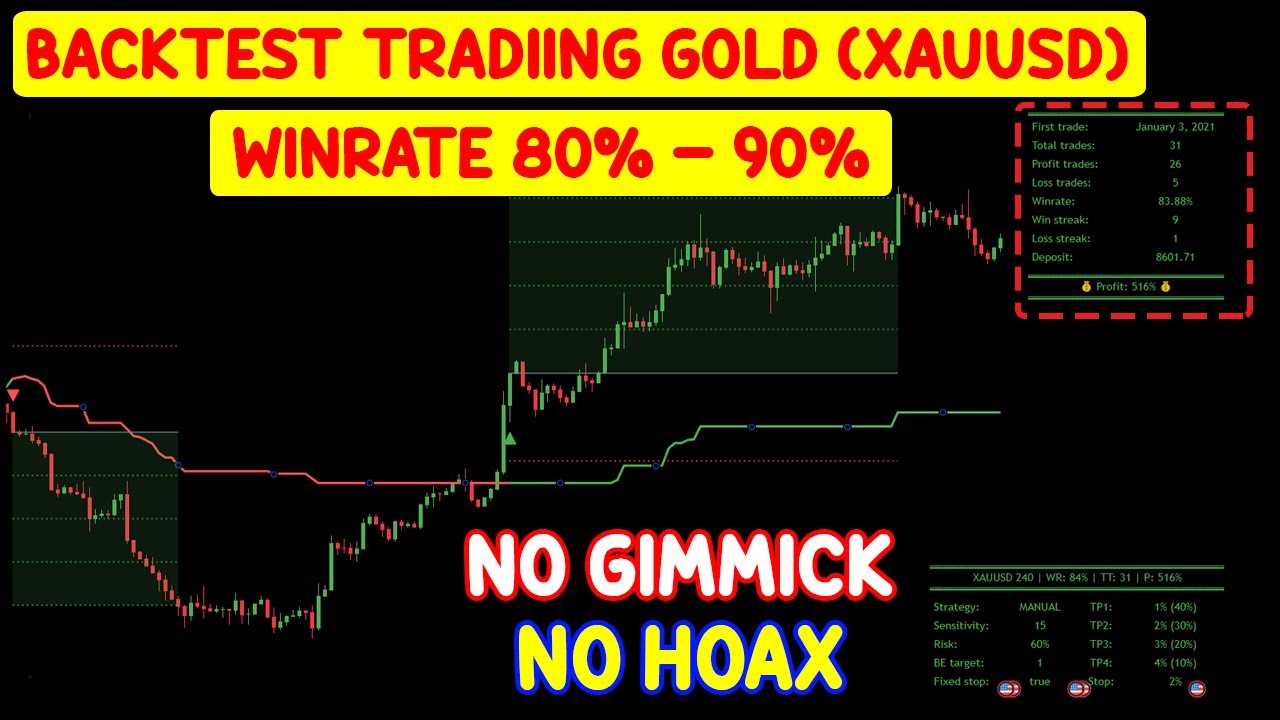
Backtest Trading Gold (XAUUSD) Winrate 80% - 90% No Gimmick & No Hoax | Swing Trading | Day Trading
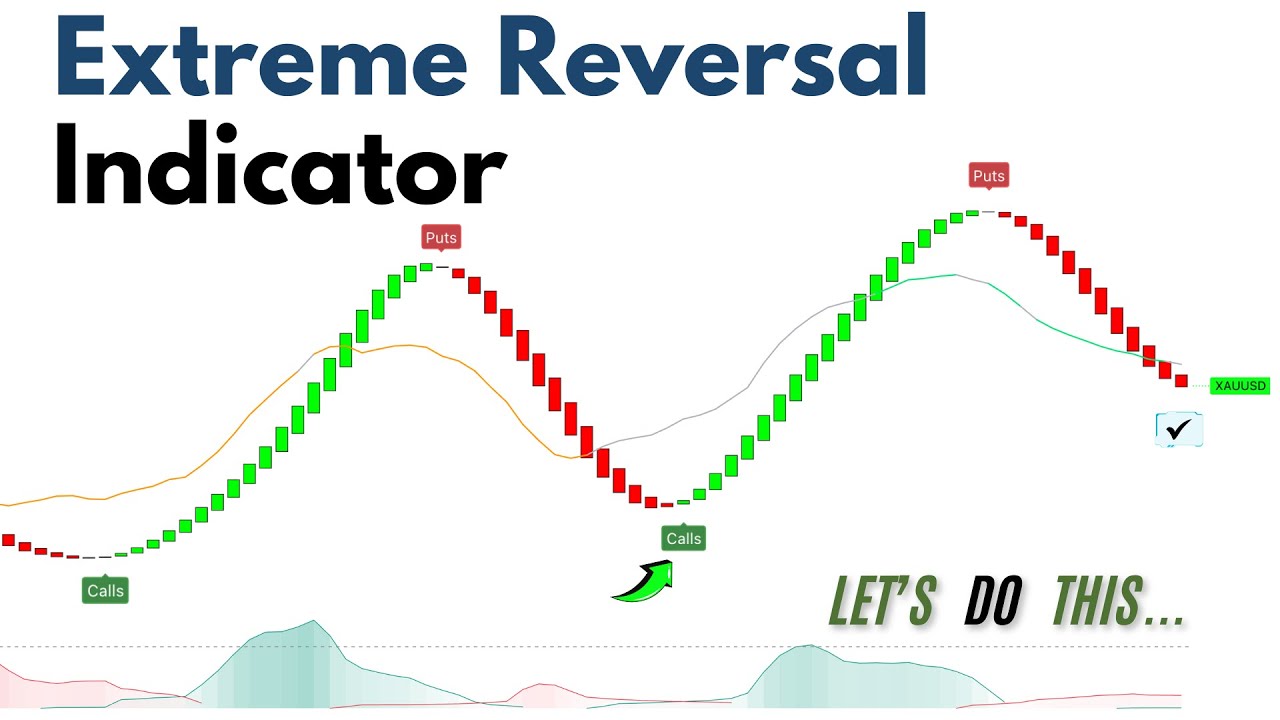
Reversal Easy Setup, Quick Profit: My Simple Trading Secret!
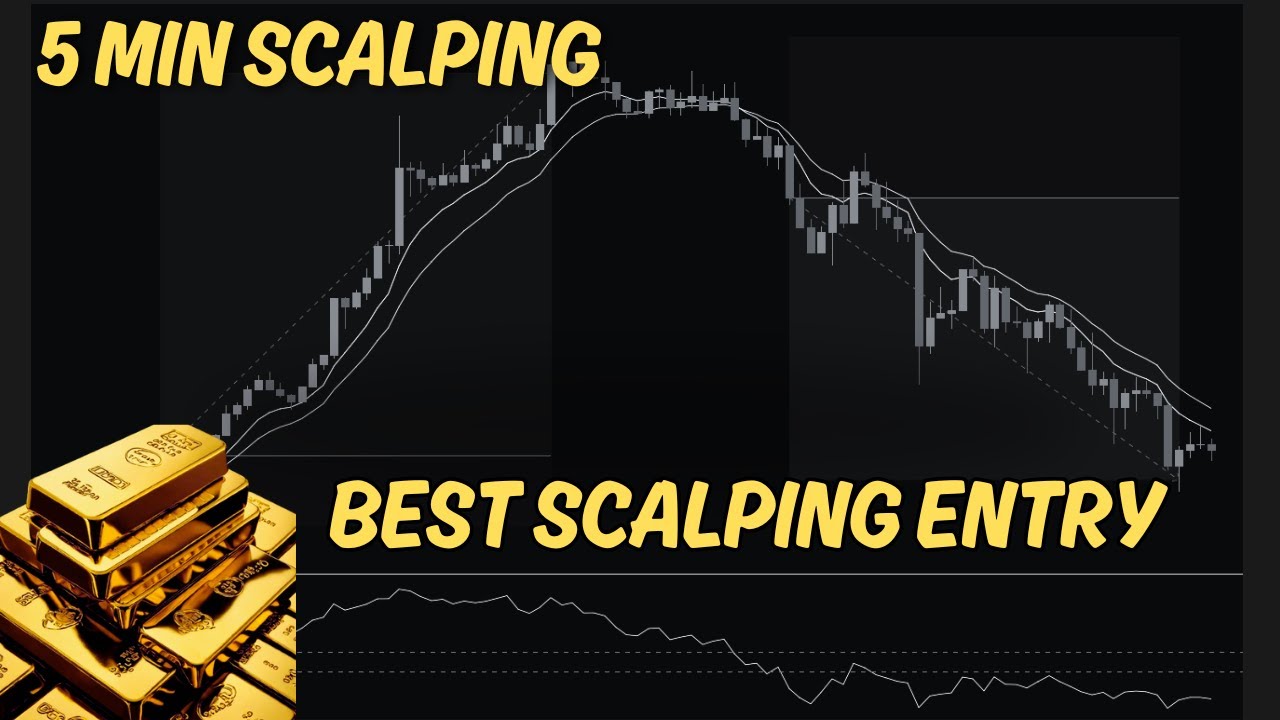
The Ultimate Gold Scalping 5 Min - Scalping Strategy For Quick and Easy Profits

15 Best Trading Indicators After 10,000+ Tests (100% ALWAYS WIN)
5.0 / 5 (0 votes)
