How to Find Daily Bias (Updated 2024)
Summary
TLDRIn this video, the creator breaks down their updated strategy for identifying daily bias in trading using premium and discount price levels. They explain how to determine the market's bias based on whether prices are in a premium (overpriced) or discount (underpriced) range. By combining these concepts with previous strategies and chart analysis, the video offers a practical method for finding trades in both uptrends and downtrends. Viewers are encouraged to tap into daily streams and apply the outlined techniques to improve their trading approach, with real-life examples and actionable insights provided throughout.
Takeaways
- 😀 Understanding daily bias is crucial for successful trading, and different strategies work for different people.
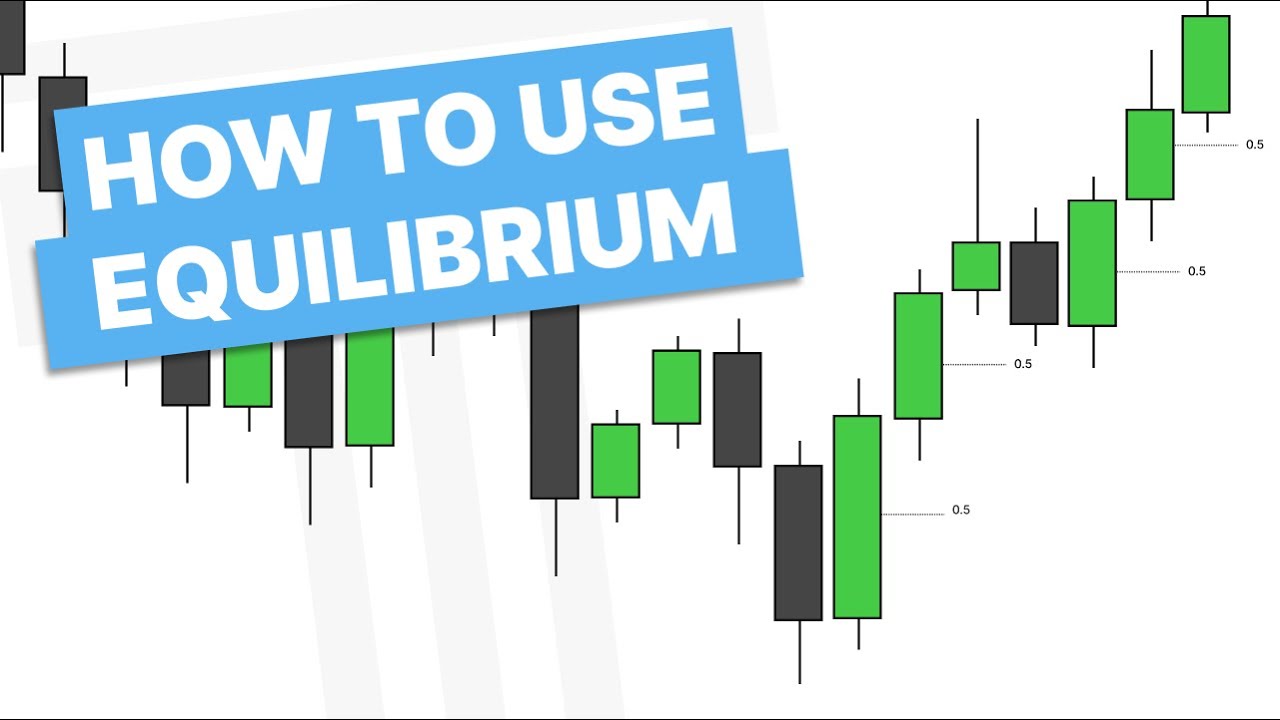
- 😀 The current method for finding daily bias revolves around identifying whether the market is in a premium or discounted price range.
- 😀 Premium refers to price levels above equilibrium, while discount refers to levels below equilibrium.
- 😀 If the price is in a premium, you should flip your daily bias and aim for equilibrium as the target.
- 😀 In an uptrend, buying is preferred if the price is in the discounted range, but you should aim for a retracement if in a premium range.
- 😀 A break of structure (either up or down) on higher time frames can help confirm the overall bias for the day.
- 😀 When price extends too far in one direction, it's likely due for a retracement to equilibrium before continuing.
- 😀 Using the 4-hour and 1-hour time frames is helpful to spot the direction of the trend and the potential for retracements.
- 😀 Liquidity sweeps and imbalance in price action are key indicators to identify when price is likely to retrace towards equilibrium.
- 😀 The fractal nature of price means that patterns and principles that work on higher time frames can be applied on lower time frames as well.
- 😀 The approach requires patience, as price action moves in waves, and it's essential to identify the right time for entries based on the overall bias and price levels.
Q & A
What is the main focus of the video script?
-The video script focuses on teaching viewers how to find daily market bias using premium and discount price ranges. The speaker explains their updated strategy and provides examples to help traders identify when to look for long or short trades depending on the price level.
How does the speaker define premium and discount price ranges?
-Premium is when the price is above the equilibrium level, and discount is when the price is below the equilibrium level. The speaker uses these levels to determine whether to go long or short in the market.
What is equilibrium, and how is it used in determining daily bias?
-Equilibrium is the middle point between the low and high of a price range, and it's crucial for determining the balance between supply and demand. The speaker uses it to decide whether the market is in a premium or discount, which influences whether the daily bias should be bullish or bearish.
How does the speaker's strategy differ from their previous approach?
-The speaker's updated strategy allows for more flexibility. While the previous strategy focused on identifying buys in an uptrend on the 4-hour and 1-hour charts, the new approach allows for trades in both directions depending on whether the price is in a premium or discount range.
What is the significance of identifying whether a market is in a premium or discount range?
-Identifying whether the market is in a premium or discount range helps traders decide whether to go long or short. A premium suggests the market is overbought, and a discount suggests the market is oversold, which can help traders align with the overall trend or go against it when appropriate.
Why does the speaker emphasize using both the 4-hour and 1-hour charts?
-The speaker emphasizes using the 4-hour and 1-hour charts because they provide a good balance of detail and context for determining the daily bias. The 4-hour chart helps establish the overall trend, while the 1-hour chart helps fine-tune entries and exits.
How does the speaker handle situations where the market structure suggests one thing but the price action suggests another?
-In such cases, the speaker looks for confluences on lower timeframes to adjust their bias. For example, if the market is in an uptrend but in a premium range, the speaker may look for short opportunities based on signs of bearish price action in lower timeframes.
What role do liquidity sweeps play in the speaker's strategy?
-Liquidity sweeps are used to identify areas where price may reverse. The speaker looks for liquidity sweeps as signals that price is likely to retrace or continue in the opposite direction, particularly when they coincide with other indicators like breaks of structure or equilibrium levels.
What does the speaker mean by 'market fractality' and how does it impact the strategy?
-Market fractality refers to the idea that price patterns repeat across different timeframes. The speaker uses this concept to apply the same principles across various timeframes, allowing for adjustments in bias based on lower timeframe confluences even when the overall market structure is in an uptrend or downtrend.
How does the speaker suggest managing trades when the market is in an extension?
-When the market is in an extension (after a strong move in one direction), the speaker suggests looking for retracement opportunities back to equilibrium. This can be done by observing for signs of price exhaustion or reversal in lower timeframes, such as break of structure or liquidity sweeps.
Outlines

このセクションは有料ユーザー限定です。 アクセスするには、アップグレードをお願いします。
今すぐアップグレードMindmap

このセクションは有料ユーザー限定です。 アクセスするには、アップグレードをお願いします。
今すぐアップグレードKeywords

このセクションは有料ユーザー限定です。 アクセスするには、アップグレードをお願いします。
今すぐアップグレードHighlights

このセクションは有料ユーザー限定です。 アクセスするには、アップグレードをお願いします。
今すぐアップグレードTranscripts

このセクションは有料ユーザー限定です。 アクセスするには、アップグレードをお願いします。
今すぐアップグレード関連動画をさらに表示

The Only ICT Daily Bias Video You'll Ever Need
You Are Using Discount and Premium Wrong! - EQ For Expansions
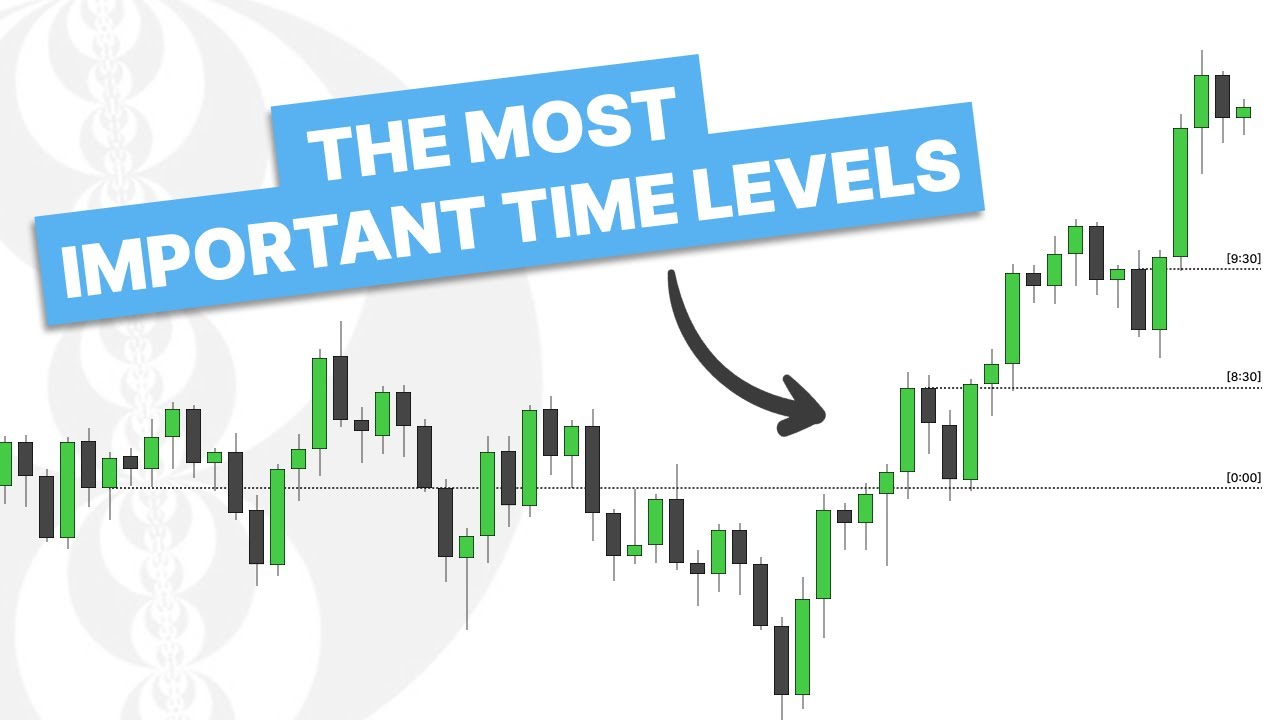
Important Time Levels For Trading
ICT Mentorship Core Content - Month 1 - Equilibrium Vs. Premium
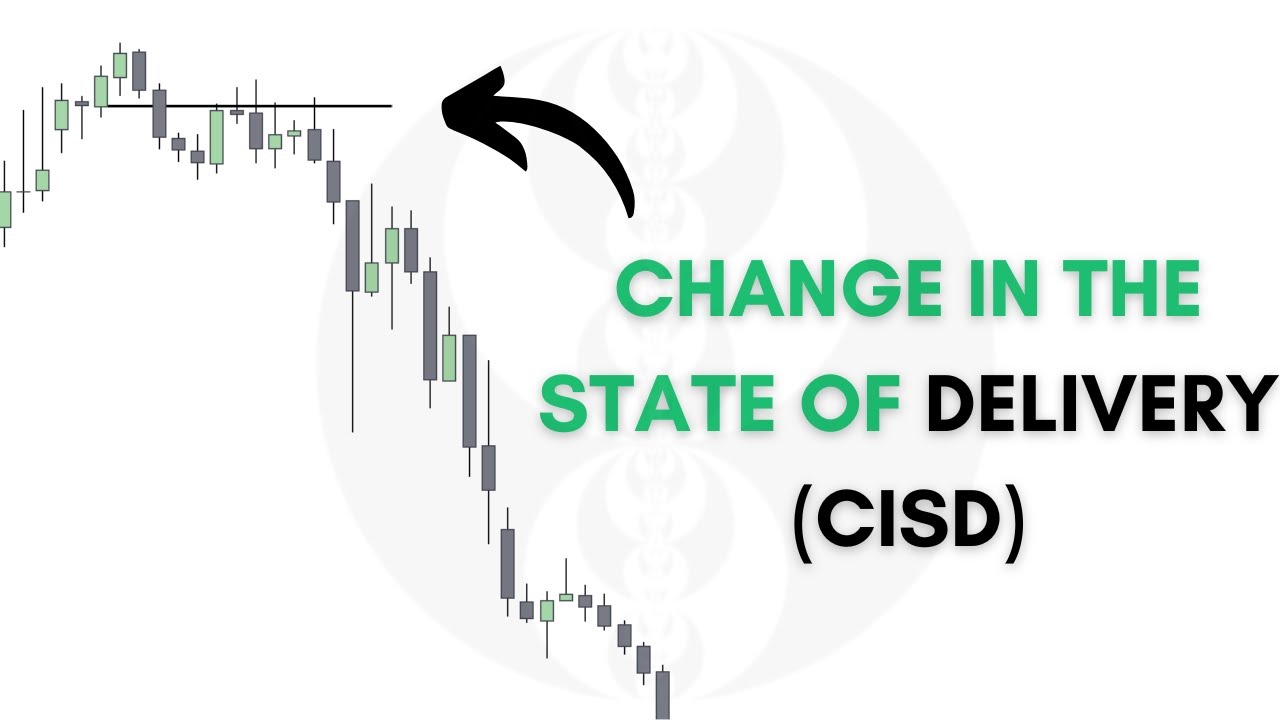
Change In The State Of Delivery (CISD) - Reversal Confirmation

ICT Daily Bias Was Hard, Until I Understood This
5.0 / 5 (0 votes)
