NVDA Stock - Did Bears Fail Yet Again??
Summary
TLDRIn this Nvidia daily update, the host discusses the stock’s current performance, including its daily movements, technical analysis, and potential trends. He highlights key support and resistance levels, such as a trendline, and outlines potential bullish patterns like a rising triangle. Emphasizing risk-reward considerations, the host suggests possible trade setups and stresses the importance of holding key levels, particularly the 179 mark. Despite some concerns with the MACD, the overall outlook remains positive for bulls. He also touches on options flow, concluding that the bullish momentum is still intact for Nvidia.
Takeaways
- 😀 Nvidia stock closed up 0.75%, at $180.77 per share, in line with the overall tech sector performance.
- 😀 The market analysis suggests Nvidia is in a tricky spot, potentially a liquidity sweep or a fresh high, making the short-term outlook uncertain.
- 😀 The key level for bulls to watch is the trendline, which is crucial for maintaining upward momentum.
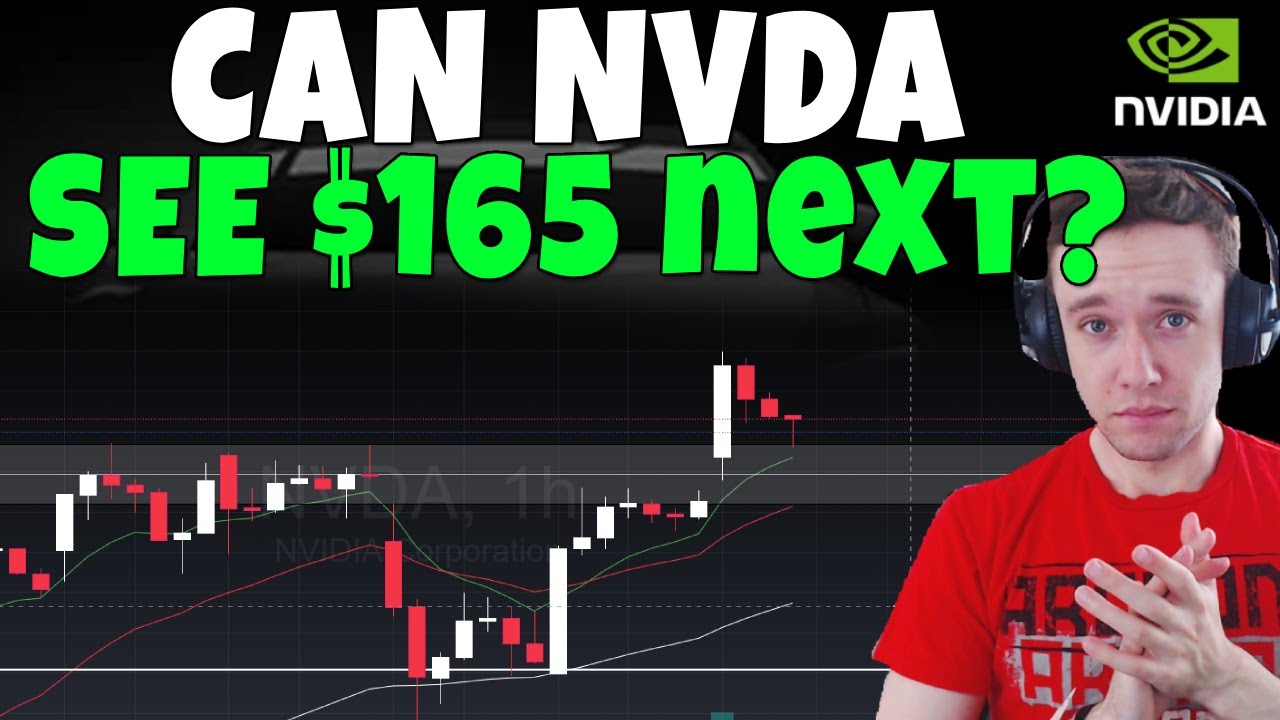
- 😀 A breakout above $183 could signal bullish continuation, with a target of the low $190s in the near future.
- 😀 The risk-reward for entering Nvidia around its current levels looks decent, with a potential 3.77:1 risk-reward ratio based on a $178.7 stop loss.
- 😀 A potential rising triangle pattern is forming, showing higher lows and equal highs, which could indicate a continuation of the uptrend.
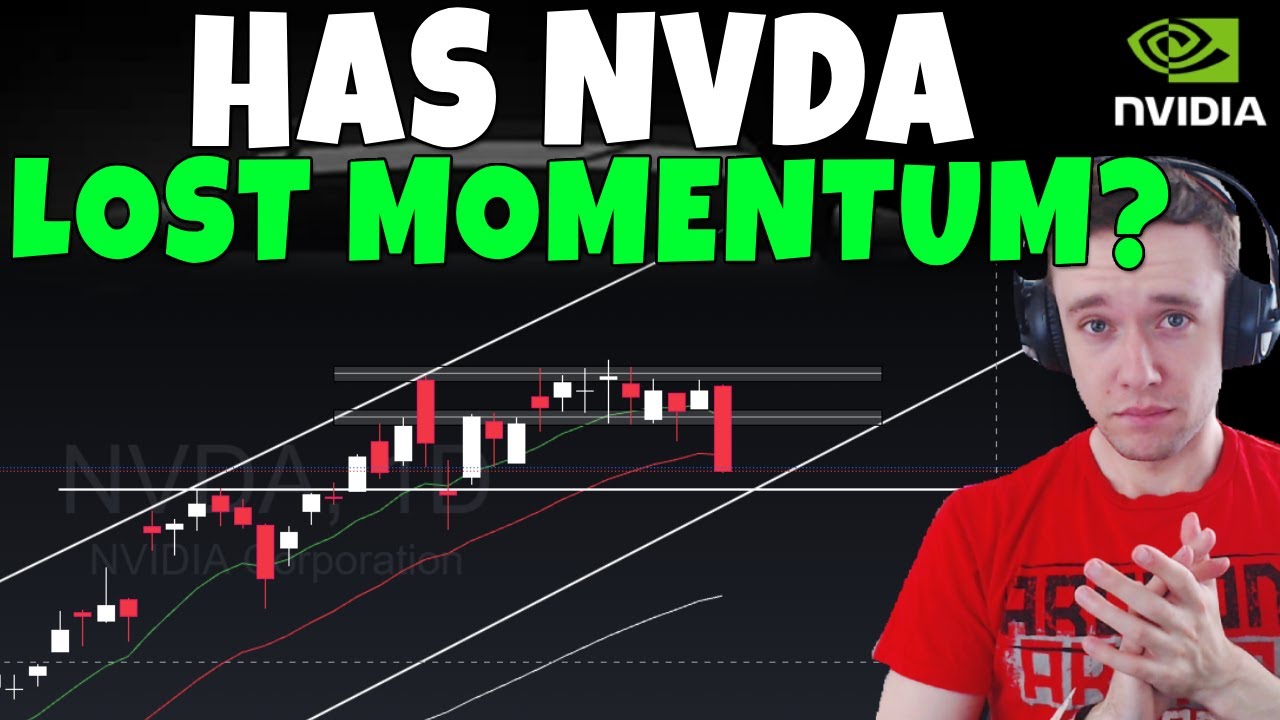
- 😀 The MACD (Moving Average Convergence Divergence) shows lower highs, which is a concern for some analysts, indicating a potential risk.
- 😀 The 9 exponential moving average is a key support level for bulls to maintain, and any closures below $179 could signal a reversal.
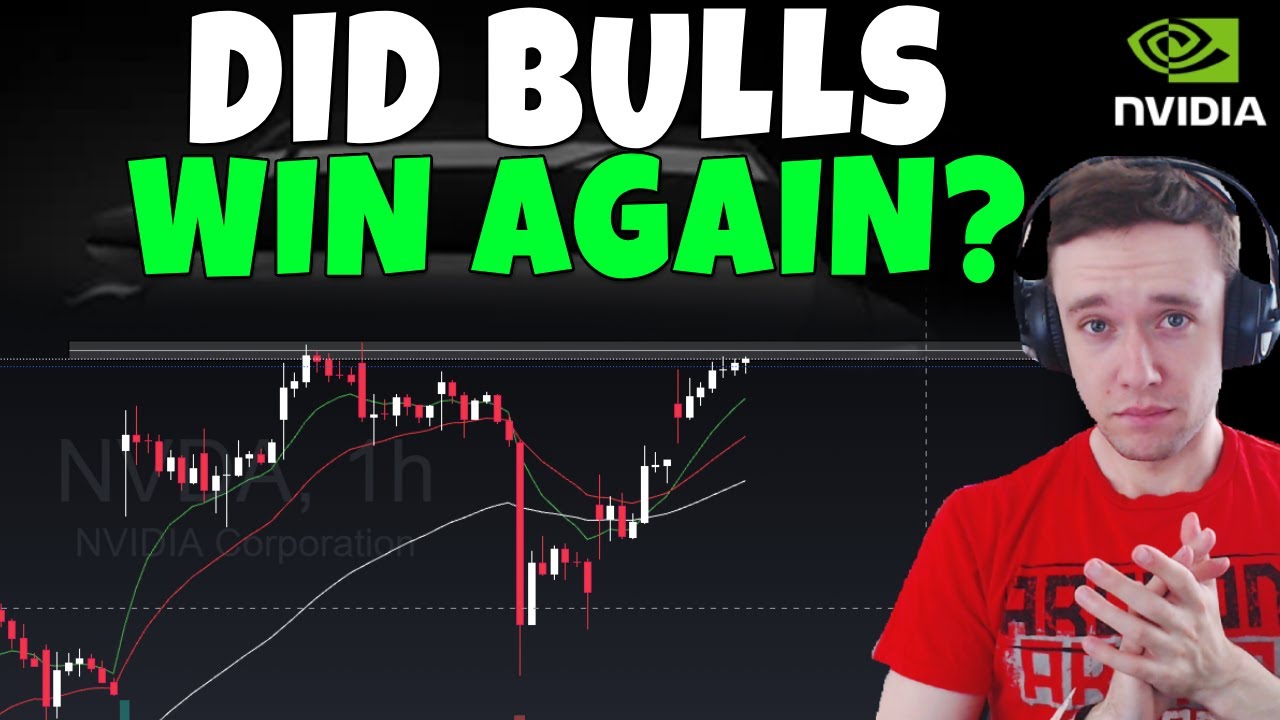
- 😀 The weekly MACD histogram is still showing higher lows and higher highs, signaling continued bullish momentum, barring a significant market downturn.
- 😀 The options flow indicates that bulls are in control, with the potential for upward movement if the stock holds its current levels.
Q & A
What is the focus of this Nvidia daily update video?
-The focus is on analyzing Nvidia's stock, its recent performance, and potential future movements based on technical analysis and patterns. The video also highlights the importance of market updates shared with subscribers.
What type of subscription service does the speaker offer to their viewers?
-The speaker offers a subscription service where members can receive daily updates on stocks like Tesla and Nvidia, along with technical analysis, chart setups, and Discord interactions for $3-$7 a month.
How does the speaker assess Nvidia's stock movement today?
-The speaker mentions that Nvidia closed the day up by 0.75%, at $180.77 per share, which is in line with the broader market performance, particularly driven by tech stocks like Apple.
What is the significance of the trend line discussed in the video?
-The trend line is a key level that Nvidia has bounced off, signaling potential support. The speaker sees it as a crucial point to monitor, as a failure to hold it could indicate bearish behavior.
What is a 'rising triangle pattern' and how is it relevant to Nvidia's stock?
-A rising triangle pattern is a bullish continuation pattern that forms when a stock creates higher lows but faces resistance at an equal high level. The speaker observes that Nvidia is showing signs of this pattern, which could indicate further upward movement if it breaks resistance.
What does the speaker believe would indicate a bearish signal for Nvidia?
-The speaker believes that if Nvidia’s stock closes below $179, particularly if it falls below the 9 exponential moving average, it would signal a potential bearish trend and a loss of bullish control.
What is the speaker's stance on entering a trade with Nvidia at the current level?
-The speaker suggests that entering a position near current levels could present a good risk-to-reward ratio, with a stop loss below $178. However, they emphasize that this is just an educational suggestion and not financial advice.
Why is the MACD indicator a concern for the speaker in this analysis?
-The speaker points out that the MACD is making lower highs, which raises concerns because it suggests weakening bullish momentum. This could be a risk factor for those considering a long position.
What is the importance of the weekly MACD histogram in the speaker’s analysis?
-The weekly MACD histogram is used to assess the longer-term trend. The speaker is looking for higher highs on the MACD to confirm the ongoing bullish momentum. A lower high would indicate that the bulls might be losing control.
What is the target price for Nvidia if the breakout occurs as predicted?
-The speaker suggests that if Nvidia breaks out from the rising triangle pattern, a price of around $190 could be the target, which aligns with the top of a rising channel on the daily chart.
Outlines

このセクションは有料ユーザー限定です。 アクセスするには、アップグレードをお願いします。
今すぐアップグレードMindmap

このセクションは有料ユーザー限定です。 アクセスするには、アップグレードをお願いします。
今すぐアップグレードKeywords

このセクションは有料ユーザー限定です。 アクセスするには、アップグレードをお願いします。
今すぐアップグレードHighlights

このセクションは有料ユーザー限定です。 アクセスするには、アップグレードをお願いします。
今すぐアップグレードTranscripts

このセクションは有料ユーザー限定です。 アクセスするには、アップグレードをお願いします。
今すぐアップグレード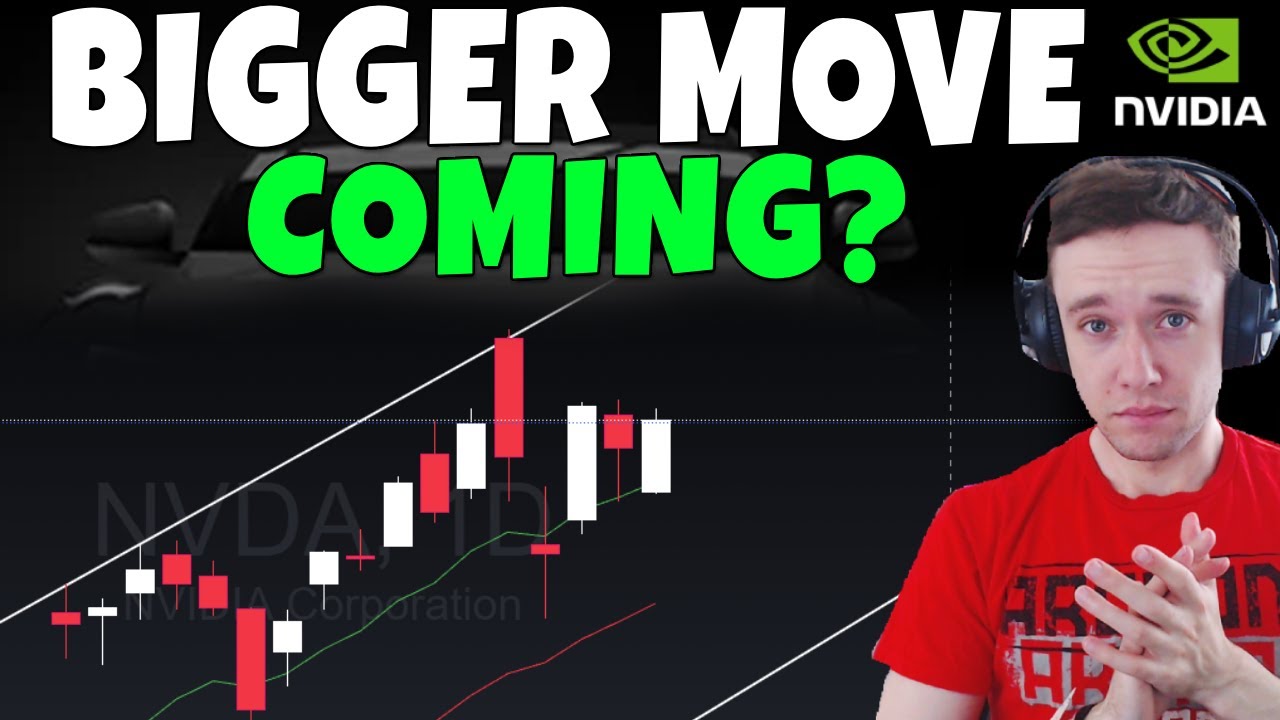


5.0 / 5 (0 votes)
