ICT Concepts - Identifying Dealing Ranges CORRECTLY 💎
Summary
TLDRThis video explains the basics of identifying and utilizing dealing ranges in trading. It defines the dealing range high and low, based on liquidity sweeps at swing points, and outlines how to use these ranges to anticipate future price movements. The tutorial walks through chart examples, focusing on how price retraces to a discount of the dealing range before continuing in the higher time frame trend. The video emphasizes the importance of identifying inefficiencies and offers a clear, structured approach to mastering dealing ranges for successful trading.
Takeaways
- 😀 A dealing range is identified by a swing high that sweeps buy-side liquidity and a swing low that sweeps sell-side liquidity.
- 😀 The basic approach to identifying a dealing range involves finding these key price points on a chart.
- 😀 The dealing range high is the swing high that captures buy-side liquidity, while the dealing range low captures sell-side liquidity.
- 😀 A clear draw on liquidity needs to be established, such as a higher time frame target for price action (e.g., all-time highs).
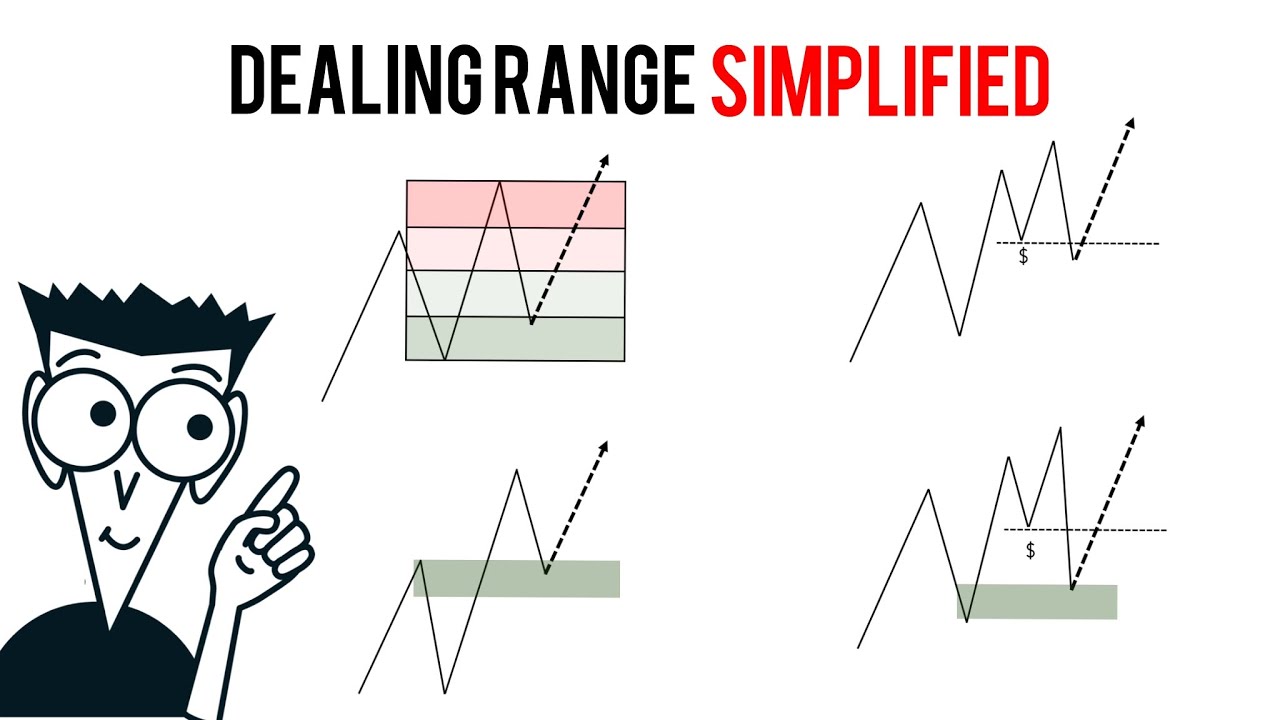
- 😀 Once the dealing range is identified, price tends to seek a discount of that range before continuing in the higher time frame trend.
- 😀 The price action typically retraces to a discount of the dealing range before bouncing back toward the higher time frame liquidity target.
- 😀 Locating inefficiencies in the dealing range's discount zone, like a fair value gap, can help pinpoint entry points for trading.
- 😀 The S&P 500 daily chart example demonstrates how a retracement after sweeping sell-side liquidity forms a clear dealing range, with a target to push higher.
- 😀 The dollar daily chart example shows how price movement can go from sweeping buy-side liquidity to sweeping sell-side liquidity within a dealing range, continuing the bearish trend.
- 😀 Understanding the interaction between a dealing range's high and low helps traders better predict market moves and find opportunities to enter trades.
- 😀 There are various methods to identify dealing ranges, and more advanced methods will be covered in future videos on the channel.
Q & A
What is a dealing range?
-A dealing range refers to the price range between a swing high and swing low, which sweeps liquidity from both buy-side and sell-side. The dealing range high is the swing high formed after sweeping buy-side liquidity, while the dealing range low is the swing low formed after sweeping sell-side liquidity.
How is a dealing range high identified?
-A dealing range high is identified as the swing high that sweeps buy-side liquidity. This occurs when the market makes a significant upward move, taking out previous buy orders before reversing.
How is a dealing range low identified?
-A dealing range low is identified as the swing low that sweeps sell-side liquidity. This occurs when the market makes a significant downward move, taking out previous sell orders before reversing.
What does a 'draw on liquidity' mean?
-A 'draw on liquidity' refers to a target level or price area where liquidity is expected to be drawn or tapped by the market. It is typically a higher or lower price level that a trader anticipates the price will reach based on their market bias.
How do you locate a dealing range when looking at a chart?
-To locate a dealing range, identify a swing high that has swept buy-side liquidity and a swing low that has swept sell-side liquidity. These points mark the boundaries of the range.
What is the significance of locating a discount in the dealing range?
-Locating a discount in the dealing range is important because it provides an opportunity for price to retrace to a more favorable level, usually closer to the dealing range low, before continuing the higher time frame trend towards the draw on liquidity.
What is an inefficiency in the context of a dealing range?
-An inefficiency refers to a gap or imbalance in the market that can be filled by price. It often appears in the form of a fair value gap or similar price structure where price has not fully retraced or filled previous moves.
How does price action in the S&P 500 relate to the dealing range methodology?
-In the S&P 500 example, the price action illustrates the concept of a dealing range where after sweeping sell-side liquidity, the price bounced to sweep buy-side liquidity. This was followed by a retracement to the dealing range low, allowing price to move towards the draw on liquidity.
How do you apply the dealing range concept to a bearish market like the dollar?
-In a bearish market like the dollar, after sweeping buy-side liquidity, the price can retrace upward before continuing lower. The dealing range is used to locate equilibrium within the range, and price may reject off the equilibrium to continue the downtrend towards the draw on liquidity.
Why is it important to measure the dealing range in a bearish market?
-Measuring the dealing range in a bearish market is important because it helps identify potential retracement levels where price may fail to continue higher and instead resume the downward trend. It allows traders to locate key areas of resistance within the range.
Outlines

このセクションは有料ユーザー限定です。 アクセスするには、アップグレードをお願いします。
今すぐアップグレードMindmap

このセクションは有料ユーザー限定です。 アクセスするには、アップグレードをお願いします。
今すぐアップグレードKeywords

このセクションは有料ユーザー限定です。 アクセスするには、アップグレードをお願いします。
今すぐアップグレードHighlights

このセクションは有料ユーザー限定です。 アクセスするには、アップグレードをお願いします。
今すぐアップグレードTranscripts

このセクションは有料ユーザー限定です。 アクセスするには、アップグレードをお願いします。
今すぐアップグレード


5.0 / 5 (0 votes)
