Market Structure Shift and Change of Character (MSS/CHOCH) | ICT | SMC
Summary
TLDRThe video explains key concepts in price action trading, focusing on 'market structure shift' and 'change of character.' It highlights how price moves through liquidity sweeps—where old highs or lows are breached—followed by energetic moves that signal a shift in market direction. The speaker demonstrates how identifying these patterns, along with a top-down analysis from higher timeframes, can aid traders in aligning with market trends and making informed entries. For further learning, the speaker recommends watching detailed trade breakdowns and free courses.
Takeaways
- 😀 The concept of market structure shifts involves identifying changes in market behavior, such as price transitioning from bullish to bearish or vice versa.
- 😀 Liquidity sweeps occur when the market clears previous price levels, often acting as a signal for potential price direction changes.
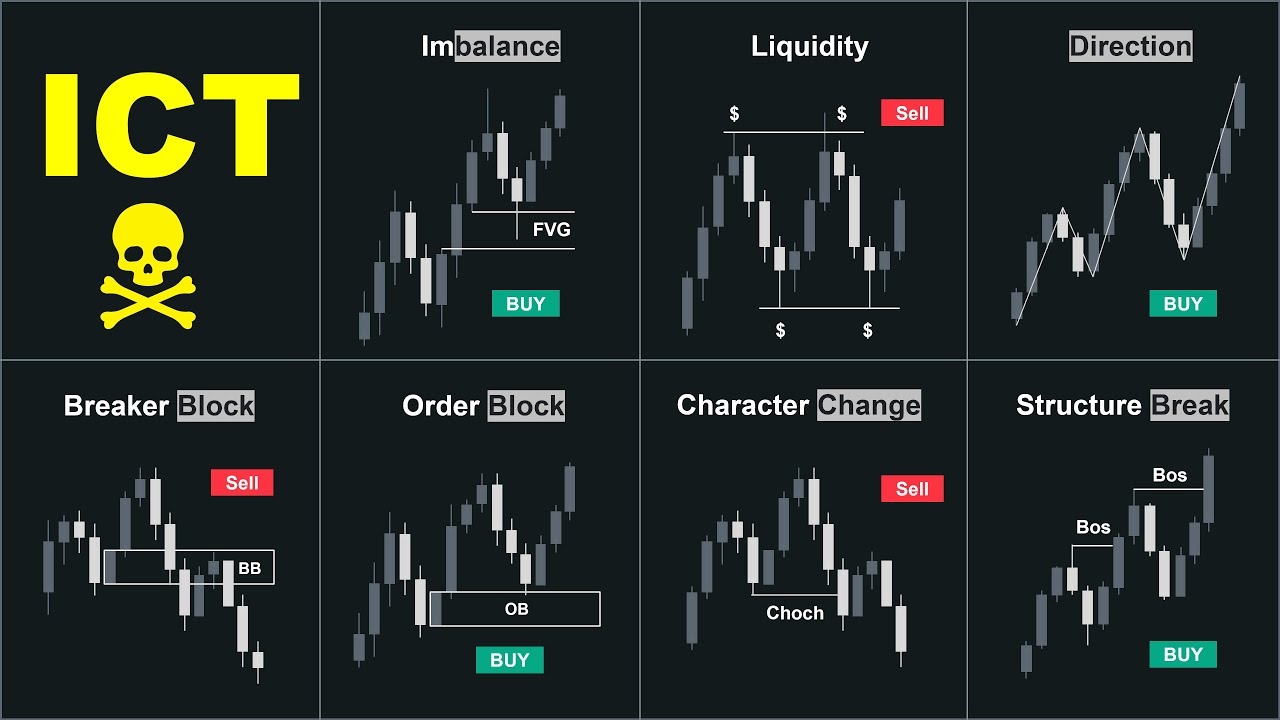
- 😀 A 'change of character' (CoC) signifies a shift in market structure, marking the transition from one trend to another (e.g., from bearish to bullish).
- 😀 Price movements can be energetic, with strong candlesticks indicating that smart money is influencing the market direction.
- 😀 In bearish markets, large bearish candlesticks may be followed by smaller bullish candlesticks, indicating a potential reversal or change of direction.
- 😀 After a liquidity sweep, the market may show a displacement, where price moves sharply in a new direction, confirming the market's character change.
- 😀 Timeframe alignment is essential: higher timeframes (weekly, daily) provide the overall market context, while lower timeframes (1-hour, 15-minute) help refine entry points.
- 😀 Traders should look for specific patterns on lower timeframes that confirm the continuation of the trend after a market structure shift.
- 😀 The shift from a bullish to a bearish market, or vice versa, requires attention to price action and candlestick patterns to confirm the change.
- 😀 Educational resources, such as the speaker's top-down analysis videos and free courses, help explain how to apply these concepts across different timeframes to inform trade decisions.
Q & A
What is a liquidity sweep in the context of market structure?
-A liquidity sweep refers to price action that moves to levels where liquidity (orders) is resting, such as old highs or lows, and takes out those orders before reversing direction. This is often seen as a prelude to a change in market trend.
What does a change of character (CoC) signify in trading?
-A change of character (CoC) signifies a shift in market structure, such as from a bearish market to a bullish one. It occurs when price action shows a significant change, like a strong move in the opposite direction of the previous trend, indicating a potential reversal or new trend.
How can traders use the liquidity sweep for trade entries?
-Traders can use a liquidity sweep as a signal for a potential change in market direction. After the liquidity sweep, traders look for a strong, energetic move that indicates the market is likely to reverse. They then watch for pullbacks and patterns on lower time frames to enter trades.
What role does market structure play in identifying trends?
-Market structure helps traders identify whether the market is in an uptrend or downtrend by analyzing the sequence of price movements. A bearish structure is characterized by lower lows and lower highs, while a bullish structure shows higher highs and higher lows.
How does price action confirm a change of character?
-Price action confirms a change of character when there is a significant reversal in the trend. For example, a series of strong bullish candlesticks could invalidate a previous bearish trend, signaling that the market may have shifted direction.
What is the importance of using higher time frames for trade confirmation?
-Using higher time frames helps traders to align with the broader market trend and provides confirmation of the change of character. Higher time frames help to confirm the validity of a potential trend reversal before entering trades on lower time frames.
What should traders look for when price pulls back after a change of character?
-After a change of character, traders should look for a pullback to the new market structure, followed by a confirmation pattern on lower time frames. This pattern, such as a continuation pattern, helps to validate that the trend is likely to continue.
What is the significance of a displacement in price after a liquidity sweep?
-Displacement refers to a strong price movement, often in the opposite direction of the previous trend, after a liquidity sweep. This displacement is important because it shows that the market is rejecting the old structure and moving in a new direction, confirming the change of character.
How can traders identify bullish versus bearish candlestick patterns?
-Bullish candlestick patterns are characterized by long bullish candlesticks that close near their high, often signaling strong buying interest. Conversely, bearish candlestick patterns show long bearish candlesticks with a close near their low, indicating strong selling pressure. Traders look for these patterns to assess market sentiment.
What is the purpose of top-down analysis in trading?
-Top-down analysis involves analyzing the market from the highest time frame (e.g., weekly or daily) down to lower time frames (e.g., 1-hour, 15-minute). This approach helps traders to identify the overall market trend and refine their entries on smaller time frames, ensuring alignment with the broader trend.
Outlines

このセクションは有料ユーザー限定です。 アクセスするには、アップグレードをお願いします。
今すぐアップグレードMindmap

このセクションは有料ユーザー限定です。 アクセスするには、アップグレードをお願いします。
今すぐアップグレードKeywords

このセクションは有料ユーザー限定です。 アクセスするには、アップグレードをお願いします。
今すぐアップグレードHighlights

このセクションは有料ユーザー限定です。 アクセスするには、アップグレードをお願いします。
今すぐアップグレードTranscripts

このセクションは有料ユーザー限定です。 アクセスするには、アップグレードをお願いします。
今すぐアップグレード関連動画をさらに表示

The ONLY Market Structure Trading Video You’ll Ever Need

Pahami 6 Prinsip Ini Untuk Menambah Akurasi Analisa || Prinsip Smart Money Concept || Full Course

Trading Course Day 5 - Understand Entries More
My List of Top ICT Concepts for Successful Trading

ICT/SMC Market Structure Full Guide Simplified | CHoCH & BOS Secrets

Identifying Key Structures & Liquidity Zones
5.0 / 5 (0 votes)
