Diagram Fasa Part 12: Lever Rule
Summary
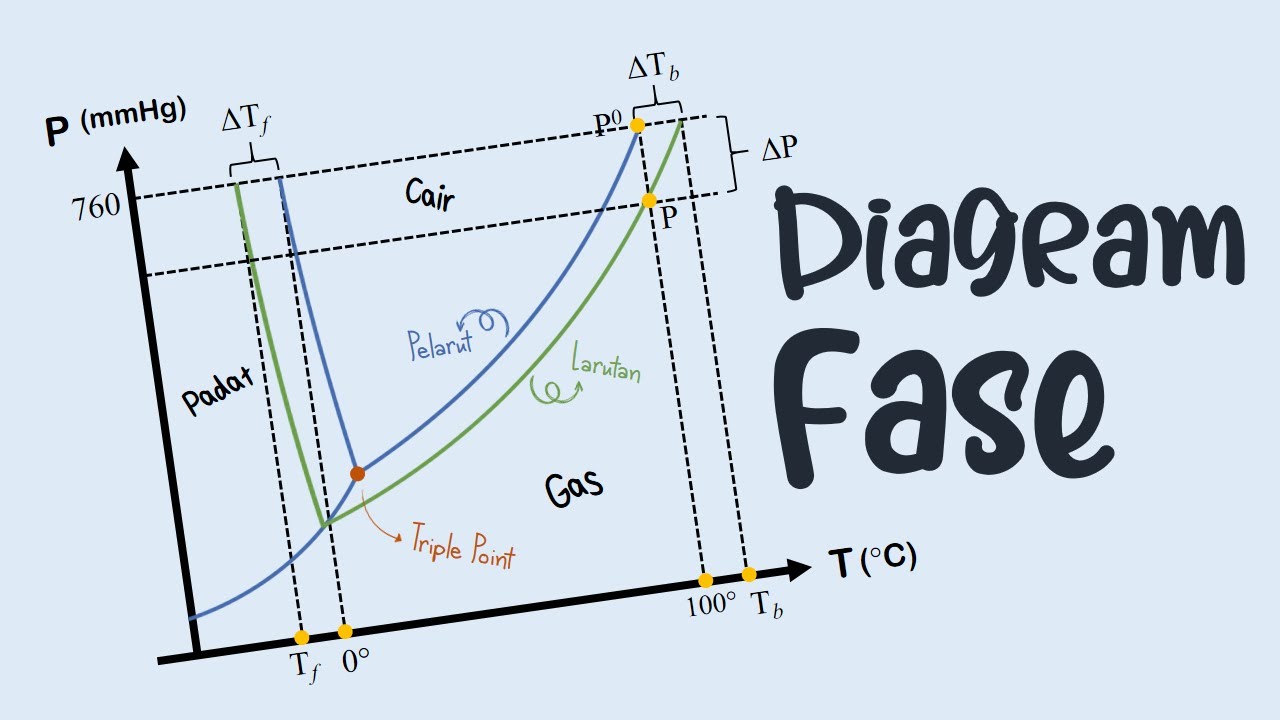
TLDRThe transcript is a detailed explanation of phase diagram analysis, focusing on liquid and solid phase compositions. It covers how to determine the ratio of solid and liquid phases, using temperature-based calculations and understanding phase composition breakdowns (such as the percentage of components in each phase). The speaker emphasizes using a 'level' parameter to calculate and compare phase quantities. This tutorial provides insights into calculating compositions at various temperatures, helping users better understand phase relationships in materials science.
Takeaways
- 😀 Understanding phase comparison is essential for determining the composition of substances in different phases.
- 😀 Mass ratio and phase number comparison are key elements in analyzing substance behavior.
- 😀 The process of calculating the amount of liquid and solid phases is introduced using the phase diagram.
- 😀 The composition of a liquid phase is typically represented by a ratio of components (e.g., 60% A and 40% B).
- 😀 When analyzing solid phases, the composition is determined by examining the intersection of the phase diagram.
- 😀 The composition of solid phases may show 100% of one substance (e.g., 100% B) depending on the phase conditions.
- 😀 At different temperature points (e.g., T2), the phase ratios change and need to be recalculated.
- 😀 The solid-liquid phase ratio in a system like T2 is used to determine how much of each component is present.
- 😀 The breakdown of the liquid composition shows how the components (e.g., A and B) are distributed in the liquid phase.
- 😀 Level lines (e.g., Lur) in phase diagrams are used to determine the ratio and composition of the formed phases.
Q & A
What is the difference between mass ratio and mole ratio as discussed in the transcript?
-The transcript emphasizes the distinction between mass ratio and mole ratio in the context of phase compositions. Mass ratio compares the mass of one substance to another, while mole ratio compares the number of moles of each substance involved in a phase transition.
How is phase composition determined in the script?
-Phase composition is determined by looking at the liquid and solid phases at different temperatures and breaking them down into their component elements or compounds, such as components A and B.
What is the role of temperature in phase diagrams?
-Temperature plays a critical role in phase diagrams as it influences the proportion of solid and liquid phases. As temperature changes, the compositions of these phases also change, with different percentages of components present at various temperatures.
What is the composition of the liquid phase at T1?
-At temperature T1, the liquid phase consists of 60% component A and 40% component B.
What is the composition of the solid phase at T1?
-At T1, the solid phase is composed entirely of 100% component B.
How is the molar breakdown of the liquid phase calculated at T2?
-At T2, the liquid phase is composed of 50% A and 50% B. The molar breakdown shows that for a total of 0.4 mol of liquid, 0.2 mol is A and 0.2 mol is B.
What happens when the liquid phase at T2 is further broken down?
-When the liquid phase at T2 is further broken down, it is found that 0.4 mol of liquid contains 0.2 mol of A and 0.2 mol of B.
What is the phase ratio between solid and liquid at T2?
-At T2, the phase ratio between solid and liquid is 3:2. This means for every 3 moles of solid, there are 2 moles of liquid.
What is the significance of the phase diagram in determining phase composition?
-The phase diagram is crucial in determining phase composition because it allows for the calculation of the proportions of solid and liquid phases at different temperatures, helping to understand how the materials behave under varying conditions.
What conclusion does the transcript make regarding the use of phase diagrams?
-The transcript concludes that phase diagrams are used to determine the proportions of different phases (liquid and solid) and their compositions, which depend on temperature. The diagram provides the necessary tools to analyze and predict phase behavior in various conditions.
Outlines

このセクションは有料ユーザー限定です。 アクセスするには、アップグレードをお願いします。
今すぐアップグレードMindmap

このセクションは有料ユーザー限定です。 アクセスするには、アップグレードをお願いします。
今すぐアップグレードKeywords

このセクションは有料ユーザー限定です。 アクセスするには、アップグレードをお願いします。
今すぐアップグレードHighlights

このセクションは有料ユーザー限定です。 アクセスするには、アップグレードをお願いします。
今すぐアップグレードTranscripts

このセクションは有料ユーザー限定です。 アクセスするには、アップグレードをお願いします。
今すぐアップグレード


5.0 / 5 (0 votes)
