Watch For THESE Signs When Buying The DIP With MEMECOINS
Summary
TLDRDieses Video präsentiert innovative Strategien für den Handel mit Meme-Coins, insbesondere im zweiten Wellenzyklus. Es erläutert, wie man nach dem Launch von Meme-Coins in Phase 1, 2 und 3 investiert, mit einem Schwerpunkt auf Phase 2, die als eine großartige Gelegenheit mit langsameren Ein- und Ausgängen, höheren Positionen und geringem Risiko für Betrug gilt. Der Sprecher nutzt Dexscreener, um spezielle Filter einzurichten, um Kandidaten für Phase 2 zu identifizieren, und diskutiert verschiedene Analysemethoden, einschließlich der Beobachtung von Volumen, Preisentwicklung und Marktkapitalisierung. Er betont die Bedeutung von Geduld und die Suche nach den richtigen Einstiegspunkten, um Gewinne von bis zu 3-10-fachen zu erzielen.
Takeaways
- 📈 **Tradingstrategien für Meme-Coins**: Der Sprecher teilt neue Strategien für den Handel mit Meme-Coins, die erwahnt, dass diese Strategien einzigartig sind und möglicherweise noch nicht bekannt sind.
- 🔍 **Wave 2 Setups**: Es wird auf Wave 2 Setups eingegangen, eine Phase nach dem Launch von Meme-Coins, die für den Handel von Interesse ist, da viele Meme-Coins nach Wave 1 scheitern.
- 💡 **Verständnis der Wellenphasen**: Es werden drei Hauptphasen (Wave 1, Wave 2, Wave 3) für neue Meme-Coins erklärt, wobei Wave 2 und Wave 3 lukrative Kaufchancen bieten können.
- 🚀 **Potenzielle Gewinne**: In Wave 2 und Wave 3 können durchaus Gewinne von 3-10x oder mehr erzielt werden, abhängig von der Auswahl der richtigen Coins.
- 👀 **Vorteile von Wave 2**: Wave 2 bietet Vorteile wie langsamere Ein- und Ausgänge, größere Positionen und nahezu keine Chance auf Betrug oder Abschlachtung (Rug Pull).
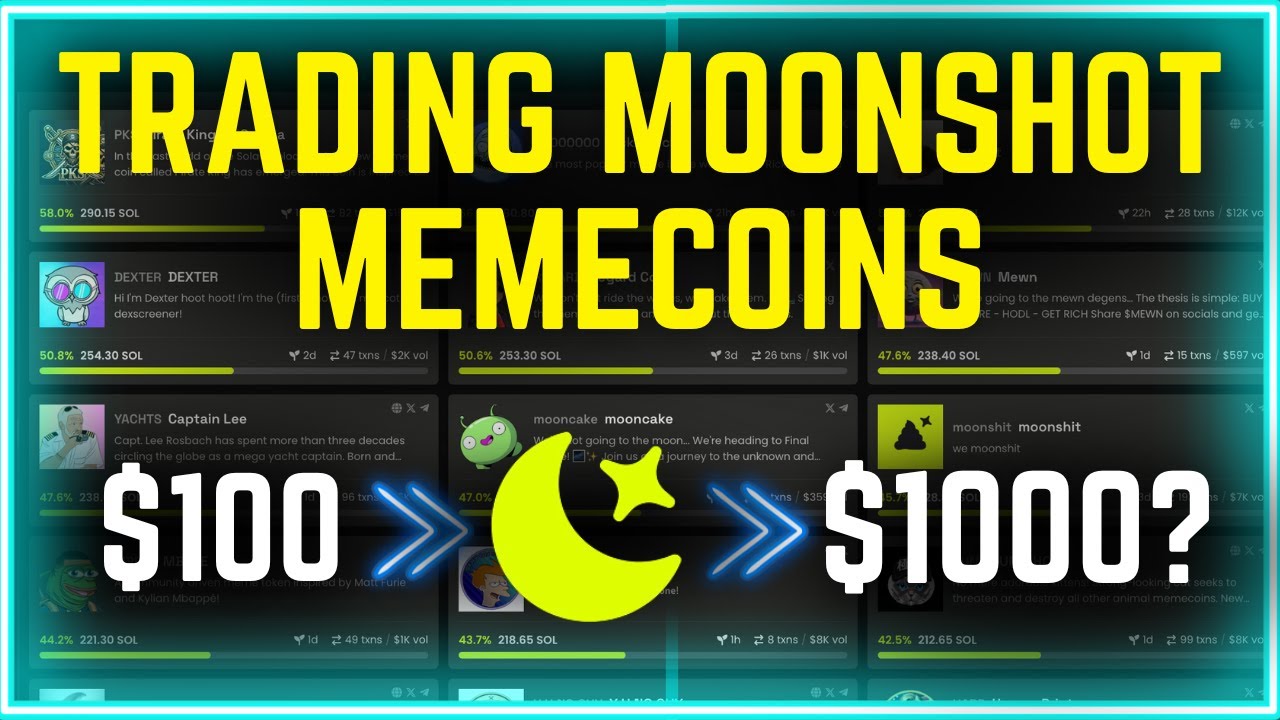
- 🛠️ **DexScreener-Filter**: Der Gebrauch von DexScreener.com zur Filterung von Meme-Coins nach bestimmten Kriterien wie Plattform, Liquidität und Marktkapitalisierung wird beschrieben.
- ⏱️ **Zeitrahmen**: Es wird betont, dass Meme-Coins innerhalb der ersten 24 Stunden nach dem Launch den meisten Handel haben, was für das Trading wichtig ist.
- 📊 **Analyse von Charts**: Es wird erklärt, wie man mithilfe von Chartanalysen nach potenziellen Wave 2 Setups sucht, einschließlich der Beobachtung von Preisbewegungen und Volumen.
- 📉 **Risiken erkennen**: Die Wichtigkeit, nicht in überschüssigen Preisen zu investieren und nach guten Pullbacks zu suchen, wird hervorgehoben.
- 🤖 **Automatisierte Handelsstrategien**: Es wird erwähnt, dass bestimmte Handelsstrategien automatisiert werden können, um schnell auf neue Marketingaktivitäten zu reagieren.
- 🔗 **Weitere Ressourcen**: Der Sprecher verweist auf umfangreichere Tutorials in der Beschreibung, die für Personen nützlich sind, die mehr über Meme-Coin-Trading erfahren möchten.
Q & A
Was sind die Hauptphasen, die in dem Video über Meme-Coins beschrieben werden?
-Die Hauptphasen, die in dem Video beschrieben werden, sind Wave 1, Wave 2 und Wave 3. Diese Phasen beschreiben die Entwicklung eines Meme-Coins nach seinem Start.
Was geschieht in der Regel nach der Wave 1 eines Meme-Coins?
-In der Regel sterben die meisten Meme-Coins nach Wave 1 ab. Sie haben eine kurze Lebensdauer, oft nur einige Stunden nach dem Launch.
Was sind die Vorteile von Wave 2 im Vergleich zu Wave 1?
-Die Vorteile von Wave 2 sind langsamere Ein- und Ausgänge, größere Positionen können gehandelt werden und es besteht fast keine Chance, dass es sich um einen Betrug handelt, da dies in Wave 1 bereits aufgedeckt worden wäre.
Welche Strategien werden in dem Video für Wave 2 genannt?
-Im Video werden Strategien wie das Beobachten von Marktlücken, das Festlegen von speziellen Filtern auf Dexscreener und das Warten auf die richtigen Einstiegspunkte für Wave 2 genannt.
Was ist ein 'Double Tap' Setup, das im Video erwähnt wird?
-'Double Tap' Setup bezieht sich auf eine Situation, in der der Preis zweimal den gleichen Support-Level erreicht und von dort abprallt, was ein möglicher Einstiegspunkt für einen Trade sein kann.
Welche Rolle spielt die Liquidität in der Wave 2-Strategie?
-Die Liquidität ist entscheidend, um zu überprüfen, ob ein Meme-Coin in Wave 2 erfolgreich sein kann. Ein Mindestbetrag von 7.000 wird empfohlen, um eine ausreichende Liquidität zu gewährleisten.
Was bedeuten die 5-Minuten- und 1-Stunden-Preisveränderungen im Kontext des Videos?
-Die 5-Minuten- und 1-Stunden-Preisveränderungen sind Filterkriterien, die verwendet werden, um Meme-Coins zu identifizieren, die möglicherweise für Wave 2 geeignet sind.
Welche Bedeutung hat die Marktkapitalisierung in der Wave 2-Strategie?
-Die Marktkapitalisierung ist wichtig, um zu überprüfen, ob ein Meme-Coin nach Wave 1 noch relevant ist. Einige Meme-Coins haben eine niedrigen Marktkapitalisierung, was darauf hindeutet, dass sie möglicherweise nicht erfolgreich in Wave 2 sein werden.
Was sind die Kriterien für die Filter, die im Video für Dexscreener verwendet werden?
-Die Filterkriterien im Video umfassen die Auswahl von Meme-Coins auf der Solana-Plattform, eine Liquidität von mindestens 7.000, einen Marktalter von 2 bis 24 Stunden und eine Aufmerksamkeit für Meme-Coins, die in den letzten 5 Minuten oder 1 Stunde eine signifikante Preisbewegung hatten.
Wie wird in dem Video der richtige Einstiegspunkt für einen Trade in Wave 2 ermittelt?
-Der richtige Einstiegspunkt wird durch das Beobachten von Preisunterstützungsbereichen, das Suchen nach 'Double Tap' Setups und das Beobachten des Handelsvolumens für einen möglichen Durchbruch ermittelt.
Outlines
📈 Handelsstrategien für Meme-Coins
Dieses Video präsentiert neue Handelsstrategien für Meme-Coins, insbesondere für sogenannte 'Wave 2' Setups. Der Sprecher geht schnell durch das Material und verwendet die Plattform dexcscreen.com. Er erklärt die drei Hauptphasen eines neuen Meme-Coins: Wave 1, Wave 2 und Wave 3. Während Wave 1 meistens kurz nach dem Launch stattfindet und viele Coins nach dieser Phase aus dem Markt verschwinden, bieten Wave 2 und Wave 3 lukrative Kaufchancen mit dem Potenzial für erhebliche Gewinne. Der Sprecher betont die Vorteile von Wave 2, wie langsamere Ein- und Ausgänge sowie die Möglichkeit, größere Positionen zu spielen. Zudem besteht fast keine Chance auf Betrug, da diese Coins bereits in Wave 1 hätten aufgedeckt werden müssen. Die Vorbereitung für Wave 2 erfolgt durch das Einstellen von speziellen Filtern auf Dex Screener, um potenzielle Meme-Coins zu identifizieren, die auf Solana basieren und eine Mindestliquidität von 7.000 haben, um eine Wave 2 Bewegung zu haben.
🔍 Analyse von Meme-Coin-Auflistungen
Der Sprecher erläutert, wie man durch die mit den Filtern gefilterten Meme-Coin-Auflistungen navigiert und welche Kriterien er anwendet, um die potenziellen Wave 2 Meme-Coins zu analysieren. Er betont die Bedeutung des Liquiditätsniveaus und des Alters der Paarung, bevor er in die Detailanalyse der Charts einsteigt. Der Sprecher bevorzugt die Analyse von 5-Minuten-Charts, um nach möglichen Einstiegsmöglichkeiten zu suchen, und sucht nach bestimmten Mustern wie 'Double Tap' Setups und Volumen-Ausbrüchen. Er warnt vor Meme-Coins, die nach einem starken Anstieg wieder stark nach unten gehen, da diese oft nicht zu weiteren Hochs schwingen. Stattdessen sucht er nach Coins, die nach dem ersten Hoch nach oben gezogen wurden und dann stabile Konsolidierungsphasen zeigen, bevor sie erneut nach oben schwingen könnten.
📊 Suchen nach Wave 2 Setups
In diesem Abschnitt geht der Sprecher auf die Suche nach Meme-Coins, die für eine Wave 2 Bewegung geeignet sind. Er betont die Bedeutung von Trendlinien und Volumen, um Einstiegspunkte zu identifizieren. Er erklärt, dass es wichtig ist, auf einen 'Double Tap' zu achten, bei dem der Preis zweimal den gleichen Support-Level erreicht, bevor er nach oben bricht. Der Sprecher warnt auch davor, in Meme-Coins mit seichten Liquiditätsreserven und unvorhersehbaren Pumps und Dumps zu investieren, da diese oft zu Verlusten führen können. Er sucht stattdessen nach Coins, die nach einem Anstieg eine Konsolidierungsphase einlegen und die die richtigen Setups für eine weitere Bewegung nach oben aufweisen.
🚀 Beobachtung von Meme-Coin-Charts für Trading-Setups
Der Sprecher analysiert verschiedene Meme-Coin-Charts, um herauszufinden, ob sie für Wave 2 Trades geeignet sind. Er betont die Bedeutung von Konsolidierungsphasen und der Stabilität des Preises, bevor ein neuer Anstieg stattfindet. Er erläutert, wie man auf der Suche nach 'Double Tap' Setups und Trendlinien ist, die gebrochen werden könnten, um eine mögliche Einstiegsmöglichkeit zu identifizieren. Der Sprecher zeigt, wie man auf 5-Minuten-Charts nach Volumen-Ausbrüchen und Divergence im Preisverhalten Ausschau hält, um die richtige Einstiegszeit zu finden. Er warnt auch davor, in Meme-Coins mit seichten Liquiditäten und unklaren Charts einzusteigen, da diese zu Verlusten führen können.
🤑 Profitieren von Meme-Coin-Trades
In diesem Abschnitt zeigt der Sprecher, wie man von Meme-Coin-Trades profitieren kann, indem er Beispiele für erfolgreiche Trades zeigt. Er erläutert, wie man auf der Suche nach Meme-Coins ist, die nach einem Anstieg einen starken Rückgang erleben und dann erneut nach oben schwingen können. Der Sprecher betont die Bedeutung von Volumen und Trendlinien, um die besten Einstiegspunkte zu finden. Er zeigt, wie man auf der Suche nach Divergence im Preisverhalten ist und wie man auf der Suche nach Volumen-Ausbrüchen ist, um die richtige Zeit für den Einstieg zu bestimmen. Er erklärt, wie man Risiken einschätzt und welche Gewinnmargen man erwarten kann, wenn man die richtigen Setups nutzt.
📊 Analyse von Top-Trader-Aktivitäten
Der Sprecher schaut sich die Aktivitäten der Top-Trader an, um zu verstehen, wer Profite gemacht hat und wie sie ihre Trades durchgeführt haben. Er zeigt, wie man auf der Suche nach Meme-Coins ist, bei denen nach dem Anstieg eine Konsolidierungsphase stattfindet, bevor ein neuer Anstieg stattfindet. Er betont die Bedeutung von Volumen und Trendlinien, um die besten Einstiegspunkte zu finden. Der Sprecher erklärt, wie man Risiken einschätzt und welche Gewinnmargen man erwarten kann, wenn man die richtigen Setups nutzt. Er ermutigt auch, die Kommentare zu nutzen, um Feedback zu den geleisteten Trades und den von ihm bereitgestellten Tutorials zu geben.
Mindmap
Keywords
💡Meme-Coins
💡Wave 2 Setups
💡DEXScreen
💡Liquidität
💡Marktkapitalisierung
💡Handelsvolumen
💡Double Tap Setup
💡Rug Pulls
💡Fibonacci-Level
💡Top Traders
Highlights
Introduction to new trading strategies for meme coins, focusing on Wave 2 setups.
Explanation of the three main phases for new meme coins: Wave 1, Wave 2, and Wave 3.
Most meme coins die off after Wave 1, but some proceed to Wave 2 and Wave 3.
Wave 2 setups offer big buying opportunities with potential gains of 3-10x.
Wave 2 entries are slower and less volatile compared to Wave 1, allowing for larger positions.
Wave 2 has nearly zero chance of being a rug or scam, as scams are usually identified in Wave 1.
Special filters on dexscreener.com for identifying Wave 2 setups: focus on Solana meme coins, liquidity above $7,000, and age between 2-24 hours.
The importance of liquidity for identifying viable meme coins for Wave 2 setups.
Wave 2 setups avoid coins with rapid price drops and low liquidity, as these are likely dead collections.
Using market cap and age filters to identify promising meme coins for Wave 2 setups.
Importance of volume and marketing in the first 24 hours of a new meme coin's life.
Strategies for sorting through collections: highest liquidity and recent 5-minute trends.
Examples of collections analyzed: Plane, Bend the Dog, and Bunk Fur, with a focus on liquidity and market cap trends.
The 'double tap' setup for identifying low-risk trades based on repeated support levels.
Risks associated with collections showing massive sell-offs and sideways price action.
Detailed analysis of specific collections, including volume trends, social media activity, and price action patterns.
The importance of patience and waiting for the right entry point in Wave 2 setups.
Successful case study of Bend the Dog, demonstrating a 5-6x gain through a well-timed Wave 2 trade.
Emphasis on not randomly buying into inflated prices and waiting for significant pullbacks.
Encouragement for viewers to leave comments about their experiences with meme coin trading tutorials.
Transcripts
in this video I'm going to show you some
more new strategies when it comes to
trading meme coins and very likely again
these strategies you will not have come
across before now I do go quite quickly
through my videos so if you need to just
put it on slow mode or something or just
rewatch the video so I'm using dexc
screen.com and we're going to discuss
Wave 2 setups if you don't know what
that is you've not been following my
videos recently let me just summarize
for you so just in case you've not seen
my videos recently I will quickly
summarize it here for you so you fully
understand we basically three main
phases when it comes to any new meme
coin Wave 1 wave two wave three
basically in the first phase that's just
immediately after launch the first kind
of couple hours or so usually most meme
coins die off after wave one literally
they don't last that long their life
span or halflife if you want to call it
that is literally just a few hours
maximum some go through a wave two move
and then very very rarely a few go into
a wave three these dips are really
really big buying opportunities where
you can easily make anywhere from 3 or
4X on average but sometimes 10x or more
so most people think all of the gains
are right at the beginning yes they are
in terms of Roi in a short space of time
however if you can cherry pick the right
ons you can sometimes get those same
rois in wave two and wave three and
today we're sharing wave two strategies
and I'm going to share with you one or
two if we can find the right setups in
some of the meme coins whichever ones we
look at today on Deck screen so because
this is a wave two we don't care about
what happened initially we care about
this period what are the big advantages
with Wave 2 very simple they're really
good opportunities there are slower
entries so you don't have to suddenly
trade second by second there's slower
exits as well you won't suddenly see
price fall that fast as compared to a
wave 1 move where literally within 2
minutes you could be at 100K market cap
and you might be down to 10K so you have
to act very very fast the other
Advantage is you can go with bigger
positions here and then the other
advantage of wave two is there's nearly
zero chance that this is a rug or a scam
if it was a rug or or a scam it would
have been found out in wave one anyway
so that's very advantageous especially
if you're a beginner and that's why one
section of my training program first
link in description below is
specifically tailored to wave two
strategies on Dex screener what we want
to do is we want to set up special
filters so we can eek out those wave two
so click on filters here I'm just on the
homepage so just click on the logo and
then click on filters now what we want
to do for the the purpose of this
example is focus on salana mem coin so
click on salana as a platform and then
click save then what you want to do is
you want to put liquidity minimum I
would say about 6 or 7,000 let's go with
7,000 any less than that and it's a
collection that's struggling a lot the
market caps too low and it's very very
unlikely to do a massive wave two move
if the liquidity is down at 2 or 3,000
we're pretty much slowly trending
towards zero there and the collection's
dead extremely rare I see them go from
2,000 liquidity or something and then
suddenly rise up it's very very rare so
we're going to play the probabilities
there so put 7,000 now I don't really
mess about with the actual market cap
pair age is important I want it to be at
least 2 hours old but preferably three
so we know wave one is completely
finished and done with and maximum 24
hours now why is it that I want it to be
24 hours and not say older ones it's
because in the first 24 hours again a
lot of people won't know this so that's
why I'll share it with you right now the
first 24 hours is where you get the most
volume typically in a new collection so
let me explain that to you it's in the
first 24 hours of a collection that's
when you get a lot of volume you get a
lot of new people looking for pairs you
see things like Dex screen and Dex tools
they have options on the left where you
can just look for new pairs and people
are dejing into these new meme coins and
that's typically when the company or
Creator or Dev whoever it is who
actually made the meme coin that's
typically when they spend a lot of money
in marketing especially at the beginning
to get that price pumping as much as
they can and they might be just throwing
darts out a d board not knowing what
will stick so they'll be pushing
Marketing in all different ways but what
that's doing is is that's helping volume
you might think the best uh meme coins
in the world like the ones that you see
doing really really well so let's say
it's called meme you might think this
one's doing this is a 3 mil market cap
because it's such a strong meme that is
not the case at all very likely the meme
is decent but more likely they jumped on
a really good narrative play for example
AI right now and they spent a good bit
in marketing to get that volume pumping
in and then once you get a lot of volume
pumping automatically what happens is it
starts showing up on many many trending
places like for example Dex screener so
at the top of deck screen I'll show you
on a collection in just a moment you'll
see all of the trending ones trending
Collections and and usually to get that
spot you need to have a lot of trading
volume that's how you get there so all
of these things kind of add together so
these are the filters I don't over
filter any more than that because you
don't need to you can see the 5 minute
and 1 hour price changes on the chart so
click apply and now these are all of the
collections we can look through so we've
got a good few there to look at so how
do we sort through these well there's a
few ways to do it one is we could just
sort by highest liquidity to lowest to
start with the larger collections first
so that's one way we can do it the other
way you can do it is we can just see in
the last 5 minutes if anything's popping
off or trending so we'll use both ways
but first of all let's just start with
liquidity let's just open these in a new
tab so we got plane here bend the dog
here and bunk fur here as well so we're
going to have a look at those and then
we'll have a look at 5 Minute trending
as well notice on paper plane when I
scroll here at the top I can see all of
the trending ones notice the first
position is actually an ad so somebody's
again paying for marketing there so just
be aware of that it's actually good if
you're your collection is doing a lot of
marketing you want them to do that
that's helping pump everybody's bags
really now with these collections as you
know we want to jump onto a smaller time
frame for a wave two I use a 5 minute
and then I drill in sometimes to a one
minute one and upwards from there now
this particular collection if you have a
look at Market Gap you can see the
liquidity is not locked so this is still
a very new collection it only just met
the criteria by the way for 3 hours like
I said mostly we don't see rugs and
stuff like that very very rare in a
proper wave two now this is just
finishing a wave 1 and obviously
struggling quite a lot this potentially
could be a scam collection we don't know
for 100% sure we'll research we would
research it more but this is not one we
would be interested in in terms of a
setup let's have a look at the others so
click on bend the dog this is more like
it so this is a collection which had a
nice pump at the beginning and notice
the pump went to 1.6 million so this is
where I spend a lot of time with
students on the training program this is
where you you can make a lot of money
but you have to be really quick however
if this drops nicely and then went back
to near anywhere near all-time highs
there's still a lot of multiples in
there anywhere like I said from 3x all
the way best case scenario usually about
10x that's a lot of multiples and as
long as you're making minimum 1.5 2x
you're doing good when it comes to
flipping meme coins so how do we know
where the price is going to stop and how
do we watch a setup here now with wave
two moves you have to be a little bit
more patient and you have to wait for
the right entry point so there's a few
things I do first of all we just mark
off where price run to before and if
there's any significant Peaks before as
well the next thing I want to do is keep
an eye on volume for any breakouts this
is where I drop down to a one minute so
I'm on a one minute chart now and I can
see the price in more detail I have a
quick glance at the socials but I don't
spend a lot of time on their telegram I
don't really need to I may just have a
quick glance at their pin messages to
see if there's any remarketing they're
doing or anything in interesting but
other other than that I don't really
care if I look at the bend the dog I see
that the um website is pretty standard
it's just probably mostly a copy of Myro
and maybe it's somebody's coin is it
somebody's coin yakovenko yeah it's
somebody's famous dog or something more
than likely we again we don't really
care because like I said it's not the
strength of the meme that's pushing this
up this is an acceptable meme with
decent marketing and that's why it's
pushed up acceptable meme decent
marketing now we can see that we're
around hovering around the price of
650 sometimes from the highs 1.6 going
down you see the same setups again and
again one of the ones you see I call it
a double tap setup and in this one we
hit the same support level twice but
it's almost identical the spot where we
hit not like this where we're hitting a
low level it's whether let's say we
Bounce from here and hit the same spot
again and we find support that's a
double tap almost like a double Top This
is a double bottom that's one of my
setups and if I see that forming along
with a downtrend line that's looking
like it will break and volume breakout
here at the bottom that's a setup and
it's a lowrisk trade for me cuz if I buy
early just after that bottom there um if
it doesn't work out and it's dropping
more I sell quickly so let's say I got
in at 650 and I sold for 550 I'm only
making a loss here of barely 10% maybe
less if I'm fast which is not a big deal
because I'm hoping to make 300% and
above so that's my risk that's my reward
so it's worth the trade this at the
moment is not really showing any kind of
setup apart from obviously massive
volume now sometimes this massive volume
is new marketing that they're doing
which is a good thing that's what you
want to watch for the other thing I look
at here is Divergence between the lows
the other one we opened here was called
uh Bank of America um and this is a
little bit of a narrative play that
we've seen recently with Central Bank
digital currencies and stuff like that
we saw meme coin so again going on a 5
minute let's see where the high is where
do we hit so if you have a look at that
oh nearly 1 million I'm surprised we
didn't quite tag 1 million but fair
enough we had this kind of double top
there and then we've been struggling
since notice we had a bounce from 200
all the way up to 500 so we've already
had a bit of a 2X there and price is
struggling a bit from there so this was
an entry point and the way you would
have picked this one up is a couple of
things one is downtrend line so it's a
clear line we tapped 1 2 3 4 5 6 7 8 so
we tapped that many many times and that
was breaking out but even after we broke
up we didn't move that significantly and
then the other thing is there's a little
bit of an increase in volume now we
don't know when you get these bounces
how high they're going to go some of
these collections will print new highs I
feel that's probably less 30% or less of
the time in my experience that's
actually rarer more likely is they
retrace back to 618 level of the
distance from here to here and then they
dump again so they might go back to
let's say where is this
900 190 somewhere around 650 700 that's
30% of the time and then 30% of the time
they just do a tiny bounce struggle and
then just fall down anyway so we don't
know for sure which way it's going to go
we're just trading probabilities
remember that you don't know for sure if
this is going to then go and make brand
new highs sometimes they do and if they
do you're going to make a lot of money
on this you're going to make at least 5
to 10x or more so while we're watching
these collections the other thing we
were going to do is click on 5- minute
trending and the good thing about that
is is it just quickly pops up anything
that's pushing at the moment and pumping
at the moment so we're going to click on
a couple of these and remember it's the
same filters so these are more than
likely wave two or beginning wave two
setups and which is exactly what we want
same thing again go on to market cap
we're already on a 5 minute here which
is good so this touched about 300 and
you see this this is what I'm talking
about here this one is completely dead
and it's gone back to very low liquidity
it only just met my filter here but you
can see just with the naked eye this
suddenly recovering and then going all
back to the way to 300 extremely rare if
they do a tiny bit of marketing you can
sometimes get good pumps here but it's
very risky especially when you had this
massive selling which could have been
team selling as well it just seem so
severe the sell off here so it's not a
nice chart what I look for when it comes
to a downtrend after a wave one move up
so that's wave one I want to see it kind
of sideways and grinding down like this
and creating a nice downtrend line for a
setup I don't want to see a falling
knife move straight down like this not a
good sign so you might have a a a little
play with this and yeah you might get a
little bust up to 20,000 but you are
taking a risk here cuz this has been
smashed so much everybody who's still in
it from earlier any tiny bounds they're
going to be like all right that's a
better price to sell I'll sell here and
they'll get out so this is not very
likely not going to bounce that much so
you have to be careful but on the other
hand you know it's all about Roi and
stuff technically that's a low that's a
higher low so we are seeing a tiny bit
of price movement but yeah it's it's
honestly not worth it blood here is
another one liquidity is getting a
little bit low but still okayish market
cap here so this one just went straight
up at the beginning and I don't I really
don't like those setups straight to 1
million within like 5 minutes and then
has been Str Ling ever since so this is
not really a nice chart that you would
want to trade it's not the classic slow
grind up more Community get involved bit
more marketing and then we push down to
a higher low and then we set up for a
wave two cuz that's the point the ones
that actually run to all-time highs
again are the ones that bounce somewhere
a lot higher than the starting price if
they if they're going all the way back
down to well not quite zero but where
they started like 3 or 4,000 then it
can't be a wave two that's going to run
to higher highs it's at best going to be
a very weak retracement so just remember
that it's the ones that I'm looking for
that run really well at the beginning
maybe to 1.6 million like we saw bounce
at like 700,000 600,000 and then move
forward I'm just having a look at a
couple more we're not really seeing good
setups but like I said it's all about
being patient if I see one I'll I'll
more than likely trade it so let's have
a look and see with this one this one
again I can just quickly from the chart
I don't need to change it to market cap
this would not be what I'm um interested
in now some of these that are going
sideways with the volumes dropping
remember you only make money if you're
buying here and the price goes up here
for these ones that never really get any
kind of pump or proper dump or anything
what are you really buying you're buying
here the price has clearly been sideways
for many many hours what's to say it's
not just going to stay like that why is
it going like this many reasons many
reasons but one of of them could be that
they're getting a little bit of interest
and then people are getting bored then
they're doing a bit of marketing then
people getting bored again it could be
many many reasons sometimes these can be
obviously rugs and scams as well rarer
at this stage but it's still possible
now I haven't done full Research into
their contract that might be the next
thing I do but the chart doesn't
interest me anyway so I don't need to so
this one's called
sperm um well they've got a website and
stuff and yeah this is probably one of
those that might be considered a little
bit funnier and that might be why it's
supposed to be good meme this has been
slowly grinding up but not in any kind
of nice predictable fashion a lot of
massive random pumps and dumps this
again won't be one I'm interested in um
because what are we trading here we're
trading we jump back in a just to get to
alltime highs maximum 2x at the same
time there's an equal risk of it going
right back down to zero no this
definitely wouldn't be one you'd be
interested in this other one here as
well called net Soul so let's look at
that it's another nice one so this one
on a 5 minute you can see there let's
get on to market cap nice pump at the
beginning all the way down from low
levels so from market cap of nothing all
the way up to 700,000 so some people
made real good money there and then how
long have been going down for it's
getting a bit long now in terms of
downtrend so it had a couple of bounces
notice when I said double Taps these
support areas so 1 2 three times they
hit the same area of 200 and we got a
couple of bounces one to 600 and one
here here to uh about 450 so these were
some good bounces but note that these
were retracements so these did not go
far I wonder how far this one went up
let's just have a quick look at that one
so this went up all the way to 618 is
there the green line you see that so so
618 is a very common it's a it's a
golden Zone it's a Fibonacci level um
that's a very common retracement level
to keep an eye on so this would have
been a good selling point now as we're
going further down here you can see
there's a trend line forming which is
good down trend line we've had bounces
so even on the way down you get bounces
but you can see very clearly even
without me telling you this is extremely
unlikely to run back to all-time Highs
but that's okay maybe we don't need
all-time highs we just need a good solid
retracement from a low level so what I'm
looking for here is it it can keep
consolidating going sideways maybe going
down sideways and then if it touch this
line again and we get a higher low again
you have have to be patient for a setup
and we see volume go up a bit we might
be able to get a trade out of it
especially if it double bottom here at
990,000 marks if it hits this again get
some support and then goes up we might
be able to get a 90 going all the way up
to 200 to 300 so you may get a 2X or a
3X and remember these are slower these
are 5 minute candles so even at this
level here that I showed you the 90
level it wasn't like it was there for a
second so if you have a look here we're
at this low level around 90 92 93 for
about what 5 10 minutes so you can
really take your time and get in that
trade and then we saw a higher low here
so stairs going upward so so you can
take your time and get in and you could
take your time kind of and get out here
we were at the 1450 Mark kind of
sideways for a while so with these ones
you just have to be patient and wait for
the right setup right now as we speaking
live on this video there isn't anything
that's perfectly setting up and that's
okay this is a quick scam for me
obviously I'm doing the video I'm
talking to you guys but when I'm doing
this myself it doesn't take more than 5
minutes usually less than 5 minutes and
then if I see a couple I'll leave those
charts open and just watch them for
another half an hour and see if I see a
setup if I see setup I take a quick 2x
3x and I move on but the good thing like
I said with some of these more more the
more the ones I I was hoping to see is
anything that hit one or two mil and
came back to 500,000 and then jump back
in again with lots of liquidity those
ones I like because I can size into them
I can put a lot more in terms of
investment I don't have to just mess
about with one Soul maximum two Soul
it's more like 10 Soul 15 maybe even 20
I can put it into a position or more and
I can look to make that flip of 2x3 3x
take my take my 40 Soul U Bank it and
move on that's it that that's wave two
that's all you're doing and remember
it's an established collection there's
very little risk of rug and scam you can
take your time sizing into the position
it already has a community and interest
and it's still in that 24-hour period
where you can still get some decent
pumps so let's quickly go through some
of the ones we were watching and quickly
X Out of the ones that we're definitely
not interested in this is sideways one
doing nothing don't even know if it's a
legic collection and it's struggling
with PR PR that can close this was the
one that I said it didn't even push up
to any kind of decent market cap or
anything like that so that can go as
well this is one we're watching it's
still at a decent market cap so we are
watching this and it did reach 700,000
so we may get a bounce so we'll just
watch this for a couple of minutes to
see if we can get a setup this one plane
that looked sketchy anyways doing
nothing struggling no volume so we X out
to that this was the one that was bend
the dog so this one have a look where do
we get to 415 market cap we start him
from 1.6 six we've had some very weak
bounces so far bit of a trend line
forming which we've touched a few times
already so yeah this could get
interesting so here I'm basically
looking for Divergence at the lows so if
you get another new low but the momentum
is going upwards this could be a
breakout at a lower level so again we'd
have to wait for this one leave that one
open this one's really struggling this
one was called blood so that's
out this one yeah market cap got too low
and you see this was the one that was
running to 12 it's just when it's that
low really you're taking a risk you're
going to get some big dumps as soon as
it moves up this is another one I've
just opened this one was called
Megatron um down here and this is what I
mean when you have a look at the chart
this is what I mean sideways price
action on a meme coin is a very
dangerous sign very likely we're going
to go down very rare you see sideways
and then we pop up it's usually v-shaped
tops and ideally v-shaped by the dip
bottoms that's what what you're looking
for like this one here where we went
from 70 back to about 250 280 but yeah
there you go this it's it's annoying
we're not seeing it in real time but
look what did you see here one tap two
tap this is my double tap strategy there
and there so we saw a push up there and
then we came back we found support here
notice this is a very very high risk
reward place because just to be wrong
here you kind of just have to take a
loss as soon as it goes below that level
not exactly like you don't want to leave
your stop loss so close like you want to
leave a little bit of space but yeah
basically yeah your risk there is about
10,000 a mon market cap nothing and then
your reward is that retrace of the highs
now we could have carried on going to
make all new uh alltime new Highs but
that's rarer but because this is a
retrace the reason I wouldn't get
involved now is because that was it that
was the bounce now we're just going to
get ever smaller bounces and obviously
the price is sideways here so I'm not
interested anyway but even if it got
here and it did some sort of Bounce
they're going to get smaller and smaller
and generally we're going down this is
against the trend like I said in one of
my recent videos videos which hopefully
you've been watching all of the mean
coin videos this will all be making
sense to you I just got busy for a short
while so I'm just now returning to the
charts about half an hour or so later
and look at this um this was one we were
looking at earlier net Soul it did push
up a little bit more to about 260 270
look at Ben the Dog we were waiting for
that setup Divergence with volume and
this one you see the trend line hit a
few times on the way down Divergence at
the lows volume breakout trend line
break out and this is atypical like I
said this is only 30% of the time or so
but alltime highs 1.6 we went way over
that so this was an entry you wouldn't
have got it perfect of 400 500 I by the
way I didn't buy this I had to leave the
screen and just come back now and I've
seen this this is kind of atypical I I
don't usually see them run this strong
but remember within the first 24 hours
actually within only the first 6 hours
or so so you are going to get these
moves this is literally what you're
looking for so we went from 500 all the
way to so far we may still keep pumping
3.5 or so so what is that 5x 6X at least
plenty plenty of profit margin there I
personally if I was in this I would have
taken a good bit of profit at this first
place where we ped which was around the
where did we go around the 2 million
level it was more like 2.5 actually so
that would have been a great way uh
great place to take profit so very very
nice move with volume um bit annoyed we
missed this but that that's it you come
you come back to the screen go to the
screen but now very important you don't
randomly ape in to overinflated prices
yes absolutely any of these coins could
go to 10 and stuff like that you never
know but even if you thought it was
always look for a good pullback like I
said that was a really good entry really
good pullback from 1.6 all the way to
4500 these are the better ones these are
the ones 1 2 million and a nice pullback
those are the ones I'm looking to trade
because the good thing is here as you
can see by these volume bars clearly
people went in with volume here so in
fact fact let me just show you you can
click here on USD let's filter let's see
if somebody went crazy nobody bought for
10,000 I mean no by the way nobody
should be buying for 10,000 because even
if you had 10,000 to invest you should
be splitting your purchases that's a
volume bot so we don't need to worry
about that one yep that's a volume bot
don't worry about that one um and let's
see if two and a half yeah this is
better so where was they buying so it
was around was it 524 sorry I'm just
going back a bit just to see where there
was Heavy buying here it was around this
this area here there's a there's a lot
of buying here um yeah you can see some
people they bought in with 3,000
unrealized 11 at least 11,000 so they
flipped $3,000 or about 30ish so into
110 Soul that's it that's a good day's
work you know 7 8,000 um dollars in
profit uh another one there same that's
the volume bot again which you can
ignore um and even here you can check on
if you want to you can check on top
Traders don't take my word for it I mean
this is just a random collection we saw
today it's not the best meme in the
world it's all right it's just another
Myro uh nice polished clean C collection
top
Traders see people already taking
profits so they've taken massive profits
here uh with very little invested $500
$700 $1,000 all flipped into $8,000
$9,000 10,000 and I see these every day
and sometimes if I get my entries right
these are
trades that I make and sometimes you
might only make like I said a 2X but
even a 2X I mean this is mcoin trading
compared to other areas of crypto you're
not going to make uh price flips like
that that quickly and with liquidity
meaning you definitely get um you know a
sell please let me know in the comments
as well if you've been watching these uh
tutorials on YouTube has it been helping
you has it been helping you make some
successful flips when it comes to meme
coins and equally important has it
stopped you losing money on collections
especially if you didn't know that there
were going to be a rug or a scam or
you've been watching my videos and you
knew this was a really really bad place
or setup to actually invest in I'm
really interested please comment below
by the way if you're interested in much
more comprehensive tutorials when it
comes to memec coin trading it's the
first link in the description below and
I'm in the process of adding some new
tutorials cuz I found there's a bit of a
glitch uh I definitely wouldn't call it
an infinite money glitch or anything yet
but basically I found a way where I
actually know when somebody's just
launched new marketing on a well-known
collection so I know when volume's about
to come in literally to the second to
the minute and the thing is I'm just
trying to work out what the best setups
are for these but basically if you know
when volume's coming before the fact you
can kind of get in there early before
the price pumps significantly so I'm
working out a few different setups we
can use for those it works very well on
salana coins in particular if you're
launching a salana meme coin you have to
do marketing you have to pay for
marketing especially things like old
trending that's it for this one thanks
for listening
関連動画をさらに表示
How To Trade MOONSHOT On Dexscreener Memecoins [Beginner Friendly Tutorial]
Risikofrei von 100x Hebel profitieren? So gehts! (Bitcoin Trading Anleitung)
Bullrun 2025: Hier Anfangen zu Verkaufen !
How To Make $10k A Month Trading
Dieses Investment hat ein 7x Potenzial!
Reich werden mit Meme Coin Krypto-Trading?
5.0 / 5 (0 votes)