Cronos (CRO): Elliott Wellen Lernen - Einen Chart Labeln
Summary
TLDRIn this technical analysis of the cryptocurrency Crow (likely Cronos), the speaker uses the Elliott Wave theory to break down the chart's price movements. The focus is on labeling different wave structures such as impulse waves and corrective waves, with a strong bearish outlook for the coin. The speaker emphasizes the chaotic nature of the chart, noting a lack of clear bullish signals and predicting a downward trend unless key price levels are breached. The analysis offers a detailed yet speculative take on potential future movements, stressing caution due to the chart's irregularities.
Takeaways
- 😀 The Crowcoin (Crow) chart is currently chaotic and difficult to analyze in a clearly bullish context.
- 😀 The speaker applies Elliott Wave theory to analyze Crowcoin's price movements, focusing on both short-term and long-term trends.
- 😀 A five-wave downward movement is identified, suggesting the current trend is bearish.
- 😀 The speaker speculates a potential ABC correction pattern with the C-wave possibly driving prices lower.
- 😀 The price movement after the ABC correction appears to be a three-wave structure, indicating that it's not clearly bullish.
- 😀 A key support level to watch is the 6.3-cent mark, and if prices break below it, the trend could lean towards a bearish C-wave.
- 😀 The speaker suggests that Crowcoin could still have a corrective rally (B-wave) but stresses that this would be temporary, not a long-term bullish trend.
- 😀 For a bullish trend, Crowcoin needs to break the resistance levels around 10.2 cents and 11.5 cents.
- 😀 A break above 54 cents is needed for a substantial bullish move, but the speaker believes this is unlikely in the current market context.
- 😀 The chart contains many erratic price movements and fake wicks, making it challenging to identify clean structures or trends, highlighting the unpredictable nature of the market.
Q & A
What is the primary focus of the analysis in the video?
-The primary focus of the analysis is on the Crowcoin (Crow) chart, using Elliott Wave theory to understand the potential market trends and predict future price movements.
What is the speaker's overall opinion on the Crowcoin chart?
-The speaker finds the Crowcoin chart chaotic and does not see any clear bullish signals in the long term. The chart is perceived as primarily showing a bearish trend.
Why does the speaker believe the chart is chaotic?
-The chart is considered chaotic due to its complex price action, which includes irregular movements and no clear, structured trend that would suggest a strong bullish or bearish direction.
What is the Elliott Wave theory and how is it applied in this analysis?
-Elliott Wave theory is used to analyze market price movements in waves. In this case, the speaker uses it to label the Crowcoin chart, identifying five-wave downward structures and attempting to categorize upward movements to predict potential future trends.
How does the speaker label the current market movement on the Crowcoin chart?
-The speaker labels the market as having a five-wave downward structure, indicating a bearish trend. The potential upward movements are considered corrections, not a full trend reversal.
What is the significance of a three-wave upward movement in this analysis?
-A three-wave upward movement suggests a corrective move, not a clear bullish trend. This is significant because it indicates that the market may not be in a strong uptrend, but instead could be undergoing a short-term correction.
What is the importance of the 10.2 cents and 11.5 cents price levels?
-The 10.2 cents and 11.5 cents price levels are key resistance points. If the price breaks above these levels, it could signal a potential reversal or shift in trend direction, moving from bearish to bullish.
What could signal a more significant bullish move in the market?
-A more significant bullish move would be signaled if the price crosses the 54-cent mark, but this would only occur if the market confirms a larger corrective rally.
Why does the speaker mention the 54-cent mark in relation to a bullish trend?
-The 54-cent mark represents a significant resistance level. If the price breaks above this point, it could indicate a major shift from a corrective phase to a strong bullish trend, though this is considered unlikely in the current market context.
What is the speaker's view on the current trend for Crowcoin (Crow)?
-The speaker views the current trend for Crowcoin (Crow) as bearish, with a downward market structure. Even if there are short-term upward movements, the overall trend remains bearish, and a reversal to bullish is not expected unless certain resistance levels are broken.
Outlines

このセクションは有料ユーザー限定です。 アクセスするには、アップグレードをお願いします。
今すぐアップグレードMindmap

このセクションは有料ユーザー限定です。 アクセスするには、アップグレードをお願いします。
今すぐアップグレードKeywords

このセクションは有料ユーザー限定です。 アクセスするには、アップグレードをお願いします。
今すぐアップグレードHighlights

このセクションは有料ユーザー限定です。 アクセスするには、アップグレードをお願いします。
今すぐアップグレードTranscripts

このセクションは有料ユーザー限定です。 アクセスするには、アップグレードをお願いします。
今すぐアップグレード関連動画をさらに表示

Elliott Waves & Fibonacci Retracement / Extension - Ep. 38 | Trading MasterClass 2.0

Ethereum Support and Resistance Levels: Latest Elliott Wave Forecast for ETH and Microstructure

Cardano ADA Price News Today - Elliott Wave Technical Analysis and Price Now! Price Prediction!
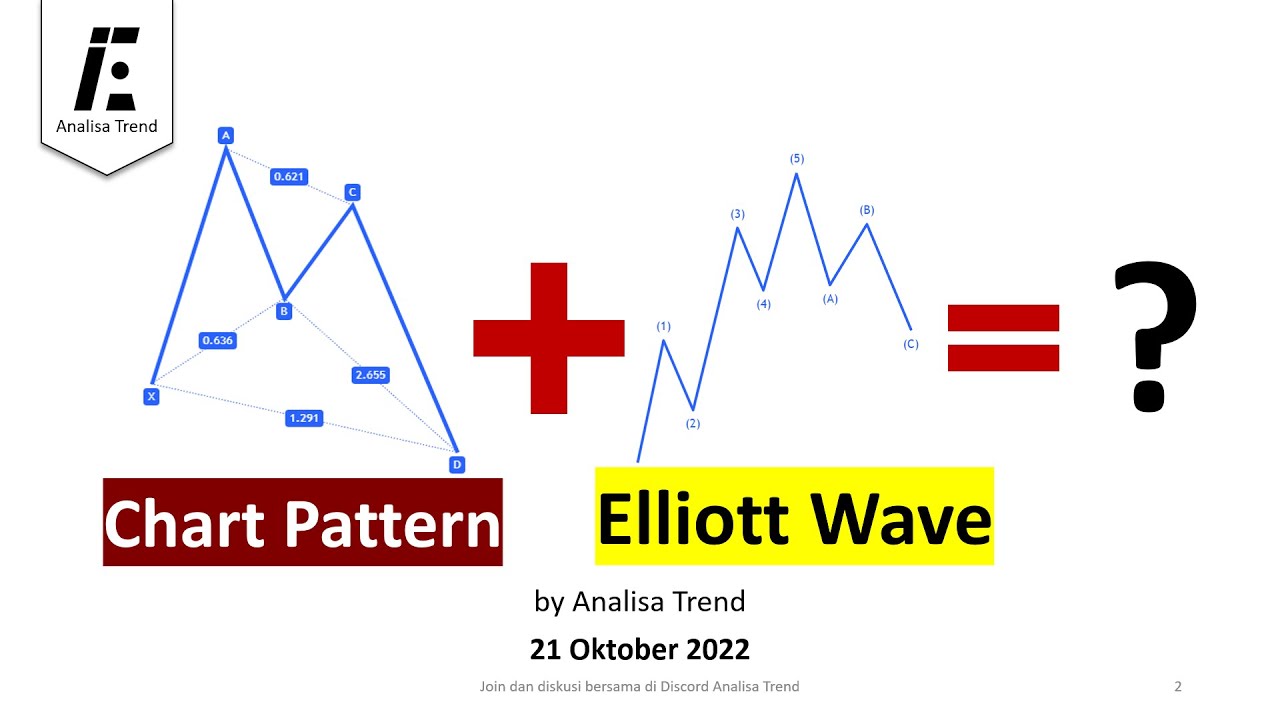
Analisis Chart Pattern dalam Elliott Wave
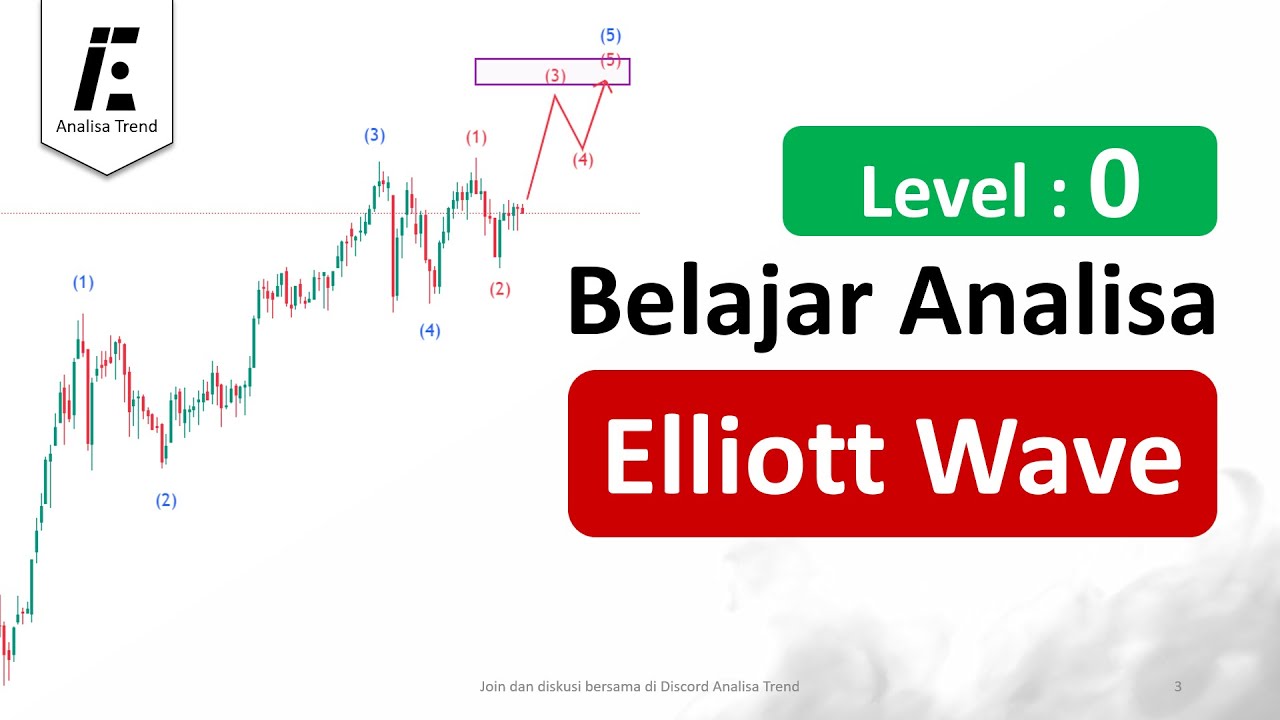
Belajar Analisa Elliott Wave level 0 | mengenal elliott wave

How the Wave Principle Helps You Make Smarter Trades - Jeffrey Kennedy
5.0 / 5 (0 votes)
