Mean from grouped data
Summary
TLDRThis video explores how to compute the arithmetic mean from frequency distribution tables, a vital skill when raw data is unavailable. It emphasizes the loss of information when moving from raw data to grouped data, necessitating the use of approximations. The process involves calculating class marks, multiplying them by their corresponding frequencies, and summing these products to derive the mean. The video illustrates that while the grouped mean provides an estimate, it can differ from the actual mean due to the inherent limitations of grouped data. Viewers are encouraged to use raw data whenever possible for precise calculations.
Takeaways
- 😀 The arithmetic mean can be calculated from raw data, but it can also be approximated from frequency distribution tables when raw data is unavailable.
- 📊 Frequency distribution tables summarize data but result in some loss of information, making it impossible to reconstruct raw data from them.
- 🔍 The class mark (M) is used as a representative value for each class in frequency distributions, calculated as the midpoint of the class interval.
- ✏️ The mean of grouped data can be approximated using the formula: Mean = (Σ(f * M)) / (Σf), where f is frequency and M is class mark.
- 🔢 The process of calculating the mean involves determining class marks, calculating frequency times class marks, and summing these values.
- 📈 It is crucial to compute both the total frequency and the total of f * M to find the mean accurately.
- ⚖️ The grouped mean may differ from the actual mean because grouping data loses detailed information about individual values.
- ❗ If raw data is available, it is recommended to use it for mean calculations instead of relying on grouped data.
- 🧮 Grouped data provides an approximation, making it a useful tool when only summary tables are accessible.
- 💡 Understanding the limitations of frequency distributions is essential for accurate data analysis and interpretation.
Q & A
What is the main topic of the video?
-The video discusses how to compute the arithmetic mean from frequency distribution tables, especially when dealing with secondary data.
Why might one need to work with frequency distribution tables instead of raw data?
-Frequency distribution tables are often used because printed reports typically contain summary data rather than raw data, which can be extensive.
What is a key limitation when using frequency distribution tables?
-A key limitation is that some information is lost in the transition from raw data to frequency distribution, making it impossible to reconstruct the original data.
How can the mean be approximated from frequency distribution data?
-The mean can be approximated by assuming that the values within each class are uniformly distributed and using the class midpoints to compute the total values.
What formula is used to calculate the mean from grouped data?
-The formula used is: Mean = (Σ(f_i * M_i)) / (Σf_i), where f_i is the frequency and M_i is the class mark.
What are class mark values, and how are they determined?
-Class mark values are the midpoints of each class interval, calculated by averaging the lower and upper limits of the class.
Why is it important to know the difference between grouped and raw data?
-Understanding the difference is crucial because using raw data yields a more accurate mean, whereas grouped data provides only an approximation.
What does the speaker suggest about the use of raw data?
-The speaker suggests that if raw data is available, it should be used for calculating the mean instead of grouped data.
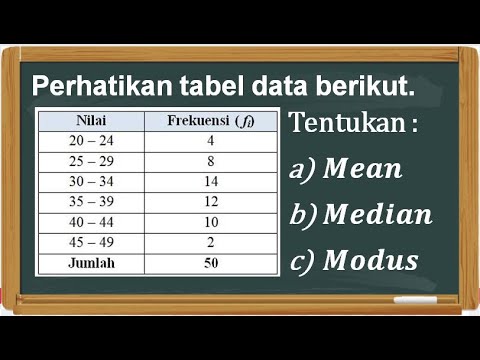
What example does the speaker provide to illustrate the process?
-The speaker provides a step-by-step calculation using group data, showing how to compute the class marks, frequency products, and ultimately the mean.
What is the final takeaway regarding the use of grouped data for calculating the mean?
-The final takeaway is that while grouped data can be used for mean calculations when raw data is unavailable, the grouped mean is generally less precise due to the information lost in the grouping process.
Outlines

このセクションは有料ユーザー限定です。 アクセスするには、アップグレードをお願いします。
今すぐアップグレードMindmap

このセクションは有料ユーザー限定です。 アクセスするには、アップグレードをお願いします。
今すぐアップグレードKeywords

このセクションは有料ユーザー限定です。 アクセスするには、アップグレードをお願いします。
今すぐアップグレードHighlights

このセクションは有料ユーザー限定です。 アクセスするには、アップグレードをお願いします。
今すぐアップグレードTranscripts

このセクションは有料ユーザー限定です。 アクセスするには、アップグレードをお願いします。
今すぐアップグレード関連動画をさらに表示

Cara menyusun tabel distribusi frekuensi, menentukan mean, median dan modus data kelompok

Kuliah Statistika Terapan - Pemusatan Data Sesi 1 Ep.04
FREQUENCY DISTRIBUTION: Common Terminologies Vid#4 FREE Tutorial | Statistics | EASILY EXPLAINED!

4.2 | DATA COLLECTION & PRESENTATION | DATA MANAGEMENT | MATHEMATICS IN THE MODERN WORLD | ALOPOGS

STATISTIKA - Cara menentukan nilai simpangan rata-rata data tunggal dan data kelompok
Menentukan Mean, Median, dan Modus Data Kelompok
5.0 / 5 (0 votes)
