Pemilihan statistik Z atau t
Summary
TLDRThis session explains when to use Z-statistics versus T-statistics in hypothesis testing, particularly for a single population parameter. The key factor is whether the population standard deviation (Sigma) is known. If Sigma is known, Z-statistics is used regardless of sample size. If unknown, T-statistics is applied, with additional considerations for the sample size and degrees of freedom. When the sample size is large (30 or more), both Z and T can yield similar results. However, for smaller sample sizes (below 30), T-statistics is preferred for more accurate representation.
Takeaways
- 🔍 **Understanding Z and T Statistics**: The discussion centers on when to use Z statistics and T statistics in hypothesis testing, especially for population parameters.
- 🔢 **Focus on Population Mean (μ)**: The session examines hypothesis tests for the mean of a single population, indicated by the parameter μ (mu).
- ⚖️ **Importance of Population Standard Deviation (σ)**: Whether the population standard deviation (σ) is known or unknown determines if Z or T statistics should be used.
- 📈 **Use of Z-Statistics**: If the population standard deviation (σ) is known, Z-statistics are preferred, based on the margin of error derived from the Central Limit Theorem.
- 📊 **When to Use T-Statistics**: If the population standard deviation (σ) is unknown, T-statistics can be used as long as the sample size is small or if it’s more practical.
- 🧮 **Sample Size Considerations**: For large sample sizes (typically ≥30), either Z or T statistics may be used, as they yield similar results; for small sample sizes (<30), T-statistics are recommended.
- 📏 **Degree of Freedom (df)**: The T-statistics require the degree of freedom (n-1), which accounts for the number of independent values in the sample.
- 📉 **T vs. Z in Small Samples**: T-statistics tend to provide more accurate representations in small samples, while Z-statistics are more practical for larger samples where freedom degrees aren't needed.
- 📊 **Large Sample Size Assumption**: In large sample sizes, T-statistics converge to Z-statistics; therefore, they can be interchangeably used as the sample size grows.
- 🧩 **Decision Tree for Z or T**: Key decisions involve checking if σ is known, then evaluating sample size. Known σ uses Z; unknown σ with a large sample can use T or Z, while unknown σ with a small sample should use T exclusively.
Q & A
What is the main focus of the discussion in the transcript?
-The discussion focuses on when to use Z statistics and when to use T statistics in hypothesis testing, specifically for a population parameter (mean).
When should Z statistics be used according to the transcript?
-Z statistics should be used when the population standard deviation (denoted as Sigma) is known, regardless of the sample size.
When should T statistics be used instead of Z statistics?
-T statistics should be used when the population standard deviation (Sigma) is unknown, and especially when the sample size is small (below 30).
What is Sigma, and how is it different from 's' in the context of the transcript?
-Sigma represents the population standard deviation, while 's' denotes the sample standard deviation. These two should not be confused in hypothesis testing.
What happens if Sigma is unknown and the sample size is large?
-If Sigma is unknown and the sample size is large (typically above 30), either T or Z statistics can be used. T statistics can substitute Sigma with 's' (sample standard deviation), but Z statistics can also be approximated for large samples.
What is the role of the Central Limit Theorem in using Z statistics?
-The Central Limit Theorem allows the use of Z statistics by normalizing the sample distribution, where the observed standard deviation is corrected by dividing Sigma by the square root of the sample size.
What is the significance of the degree of freedom in T statistics?
-The degree of freedom (n-1, where n is the sample size) in T statistics accounts for the variability in small samples, providing a more accurate estimate of the population mean when Sigma is unknown.
How does sample size affect the choice between Z and T statistics?
-If the sample size is large (above 30), Z and T statistics give similar results. However, if the sample size is small (below 30), T statistics are preferred as they provide a more accurate representation of the sample variability.
Why is T statistics more 'precise' for small samples compared to Z statistics?
-T statistics are more precise for small samples because they adjust for the increased uncertainty by incorporating the degree of freedom, which corrects for the smaller sample size.
What is the 'trade-off' mentioned between using Z and T statistics?
-The trade-off is that while Z statistics do not require degrees of freedom, T statistics are more precise for small samples but require calculating degrees of freedom. For large samples, the difference between T and Z statistics becomes negligible.
Outlines

このセクションは有料ユーザー限定です。 アクセスするには、アップグレードをお願いします。
今すぐアップグレードMindmap

このセクションは有料ユーザー限定です。 アクセスするには、アップグレードをお願いします。
今すぐアップグレードKeywords

このセクションは有料ユーザー限定です。 アクセスするには、アップグレードをお願いします。
今すぐアップグレードHighlights

このセクションは有料ユーザー限定です。 アクセスするには、アップグレードをお願いします。
今すぐアップグレードTranscripts

このセクションは有料ユーザー限定です。 アクセスするには、アップグレードをお願いします。
今すぐアップグレード関連動画をさらに表示

Jenis-jenis pengujian hipotesis: Uji Beda Rata-rata (Uji z dan Uji t)
Statistics in 10 minutes. Hypothesis testing, the p value, t-test, chi squared, ANOVA and more
Metode Statistika | Uji Hipotesis bagi Rata-rata Satu Populasi
Z-statistics vs. T-statistics | Inferential statistics | Probability and Statistics | Khan Academy

Hipotesis 2 Sampel Rata rata
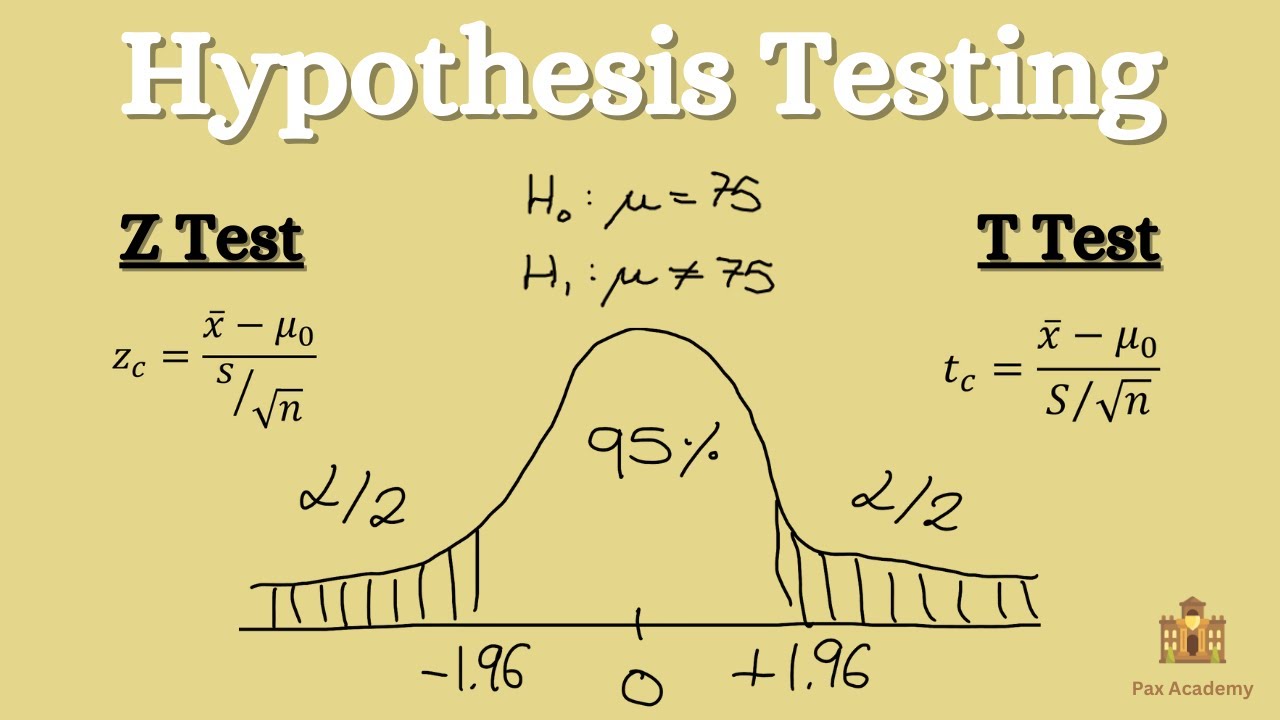
Hypothesis Testing - Z test & T test
5.0 / 5 (0 votes)
