Climate Change - A Report from Antarctica: WAIS Divide Ice Core
Summary
TLDRThis video showcases the process of drilling ice cores in Antarctica to study past climate changes. The narrator explains how the unique conditions of the site provide a detailed record of greenhouse gas fluctuations and their relationship with temperature changes over 650,000 years. The drilling tool extracts ice samples, which are analyzed for gas concentrations and isotopic ratios, offering insights into past air temperatures and CO2 levels. The video emphasizes the clear link between human activities and current climate warming, encouraging viewers to use science to inform future decisions.
Takeaways
- ❄️ The location for this ice coring project was carefully chosen for its clean, deep ice, simple ice flow, and high annual snowfall rate, making it ideal for studying past climate changes.
- 📉 This ice core project aims to provide detailed records of how greenhouse gases influenced climate changes over time.
- 🧊 Antarctica is ideal for studying the concentration of past atmospheric carbon dioxide levels due to its unique ice conditions.
- 🔬 The drill used in the project is a scientific instrument specifically designed for ice coring, shaving off rings of ice to extract samples.
- 🌡️ One of the main goals of the project is to compare the timing of past greenhouse gas changes with temperature shifts, improving the understanding of human-driven climate change.
- 📦 Ice cores are packed and transported using a complex system of planes, ships, and trucks for analysis by about 30 scientists back in the United States.
- 📊 Measurements taken from the ice cores include the isotopic ratio of oxygen, which helps determine past air temperatures, and the concentration of gases like carbon dioxide trapped in air bubbles.
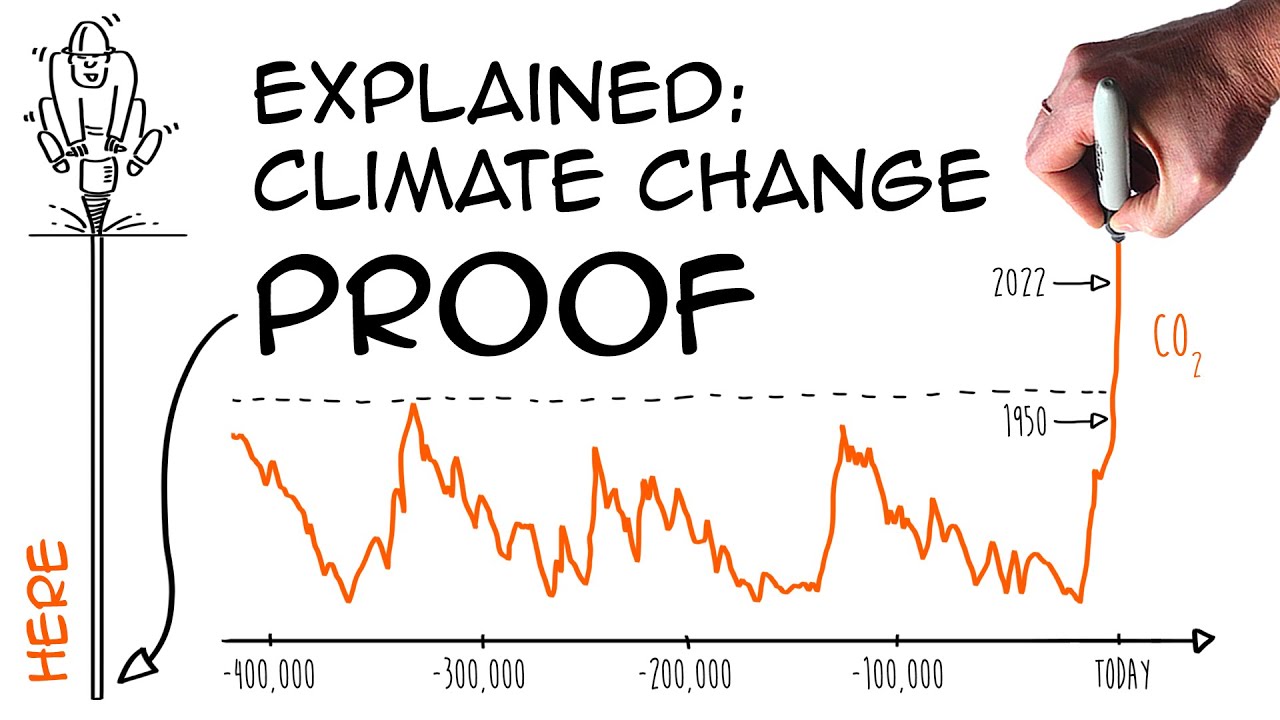
- 🌍 The study shows a strong correlation between high CO2 levels and warmer conditions over the last 650,000 years, highlighting the human role in today's climate warming.
- 🏕️ The camp for the ice coring project is temporary, with tents for personal space and structures like the dining hall set up only during the summer to avoid snow drifts.
- ♻️ The team follows strict environmental practices, taking all waste with them and recycling 85% of it to minimize their impact on the pristine environment.
Q & A
What makes this particular location ideal for studying past climate changes?
-The location has a combination of clean, deep ice, simple ice flow, and a high annual snowfall rate, making it the best place to study the details of how past changes in greenhouse gases influenced climate.
Why are ice cores important for understanding past climate conditions?
-Ice cores contain trapped gas bubbles from the atmosphere at the time the snow was compressed into ice. By analyzing these gases, such as carbon dioxide, and isotopic ratios of oxygen, scientists can determine past atmospheric conditions and temperatures.
How do scientists measure past air temperatures using ice cores?
-Scientists measure the isotopic ratio of oxygen-18 and oxygen-16 in the water that makes up the ice. This ratio changes based on the air temperature when the snow fell, allowing scientists to estimate past air temperatures.
What is unique about the drill used in this ice coring project?
-The drill used is a one-of-a-kind scientific instrument designed specifically for ice coring, unlike water well or oil well drills. It has razor-sharp cutters and operates to extract a cylindrical ice core while maintaining its integrity.
How do scientists ensure the ice cores stay preserved in the field?
-To keep the gas samples trapped in the ice, the ice cores must be kept below -20°C. A large refrigeration system is used to maintain this temperature in the field, along with cold storage in the drill shelter.
What measurements do scientists take once the ice cores are brought back from the field?
-Scientists measure the isotopic ratios to determine past temperatures and analyze the gases trapped in air bubbles to assess historical concentrations of greenhouse gases like carbon dioxide.
How do scientists use electrical conductivity to study ice cores?
-By measuring the electrical conductivity of the ice, scientists can identify annual layers because snow from different seasons (summer and winter) has distinct chemical compositions, which affect conductivity.
What relationship between CO2 and temperature is shown by ice core data?
-Ice core data shows a strong correlation between high levels of atmospheric CO2 and warm temperatures, and low levels of CO2 with colder conditions, over at least the past 650,000 years.
What does the data say about current CO2 levels compared to historical levels?
-Current atmospheric CO2 levels are much higher than at any time in the past 650,000 years, which suggests an unusual and potentially dangerous trend linked to human activities.
What is the main takeaway for the audience regarding climate change from this research?
-The data shows that human activities are contributing to current climate warming, and while the speaker doesn't offer specific policy advice, they encourage using the best available science to inform decisions on how to address climate change.
Outlines
🌍 Exploring Antarctica for Climate Science
This section introduces the remote location in Antarctica chosen for studying how past greenhouse gases influenced climate. Although the scenery is monotonous, the deep, clean ice and high annual snowfall provide the perfect conditions to extract detailed climate records. The researchers compare the timing of past changes in greenhouse gases and temperature to understand human-driven climate changes better. It took three field seasons to find this site, and it will take five more to collect all the necessary samples. The narrator also highlights the harsh conditions but praises the beauty of the location.
🛠 A Closer Look at the Unique Ice Core Drill
The narrator explains the ice core drilling setup, featuring a unique scientific instrument specifically designed for this purpose. The drill shaves off rings of ice to extract long, cylindrical ice cores. These cores are essential for studying past climate by examining trapped air bubbles and isotopic ratios in the ice. A key focus is maintaining freezing temperatures to preserve the gases within the ice cores, which help in analyzing past concentrations of greenhouse gases. The team uses a refrigeration system to keep everything below -20°C while working in harsh conditions.
📊 Studying Ice Cores for Greenhouse Gas Data
This paragraph details how scientists study the ice cores. At the field site, little measurement occurs because of logistical difficulties. Back home, scientists analyze the oxygen isotopic ratios and measure gases trapped in air bubbles in the ice. These analyses help determine past air temperatures and concentrations of gases like carbon dioxide, giving insights into past climates. A key method includes crushing ice samples to release ancient air trapped within, enabling researchers to measure the greenhouse gases present when the snow turned to ice.
🔬 Counting Ice Layers to Age the Ice
The narrator explains how scientists determine the age of ice by identifying annual layers, similar to counting tree rings. Differences in the chemical composition of summer and winter snow alter the ice's electrical conductivity, allowing scientists to count each year's snowfall. This method enables them to create precise timelines for their climate data. The ice cores are then packed in tubes and transported back to the U.S. using cargo planes and other specialized transport. A team of 30 scientists analyzes the data collected from the ice.
🏕 Life in Antarctica and Sustainable Practices
The narrator gives a glimpse into daily life at the Antarctic research camp, which houses around 50 people. Everyone has their own tent for privacy, and the camp is spacious. The team practices sustainability by recycling 85% of their waste, including wood, aluminum, and paper. Temporary buildings, like the dining hall, are removed in the winter to prevent them from being buried under snowdrifts. Despite the challenging conditions, the researchers make efforts to minimize their environmental impact and keep operations efficient.
📈 Climate Data and CO2's Role in Warming
In this section, the narrator reviews a climate graph showing the relationship between atmospheric CO2 and temperature over the last 650,000 years. Ice core data reveals a strong correlation between high CO2 levels and warmer periods, and low CO2 levels with colder conditions. This tight relationship underscores the significant role CO2 plays in driving climate change. Current CO2 levels are far higher than at any point in the past 650,000 years, emphasizing the influence of human activity on modern climate warming. The narrator concludes by encouraging viewers to consider science when making decisions about the future.
Mindmap
Keywords
💡Ice cores
💡Greenhouse gases
💡Antarctica
💡Climate change
💡Isotopic ratio
💡Air bubbles
💡Annual layers
💡CO2 concentration
💡Field seasons
💡Refrigeration system
Highlights
The location is chosen for its clean, deep ice, simple ice flow, and high snowfall, making it ideal for studying past changes in greenhouse gases and climate.
This site allows for a more detailed climate record compared to other ice core locations, which will help improve understanding of how human activity impacts climate change.
The team spent three field seasons searching for the ideal drilling site and expects to spend five more seasons collecting ice core samples.
The drill is a one-of-a-kind tool designed specifically for scientific purposes, capable of cutting and extracting cylindrical ice cores.
To preserve the gas samples within the ice cores, the temperature of the ice must remain below minus 20°C.
Each ice core extraction yields about 2.2 meters of ice, which is protected by green plastic netting during transportation.
The isotopic ratio of oxygen in the ice is measured to determine the air temperature when the snow fell, providing historical climate data.
Air bubbles trapped in the ice are analyzed to measure the concentration of greenhouse gases like carbon dioxide from the past.
The team identifies annual layers in the ice using the electrical conductivity of ice, similar to counting tree rings, to determine the age of the ice.
The ice cores are transported back to the U.S. via cargo planes, ice-strengthened ships, and trucks, where 30 scientists analyze the samples.
The graph shown highlights the correlation between high levels of CO2 and warmer temperatures, a relationship that has existed for at least 650,000 years.
Current CO2 levels are much higher than any time in the last 650,000 years, pointing to human-caused climate warming.
The camp consists of 50 people with personal tents, and they leave no waste behind, recycling 85% of materials and removing everything else.
Temporary structures like dining halls are dismantled every winter to prevent them from being buried in snow drifts.
The research shows a strong correlation between rising CO2 levels and global temperature increases, reinforcing the urgency of addressing climate change.
Transcripts
[Music]
Z
[Music]
well you're right the scenery here is
monotonous you can travel the 700 miles
to the South Pole and it looks the same
but this location is the right
combination of clean and deep ice simple
Ice Flow and a high annual snowfall rate
that makes it the best place on the
planet to study the details of how past
changes in greenhouse gases influence
climate there are other ice cores that
have climate records that extend further
back in time than we'll be able to
collect from here those are great
records but what makes this place
special is that we'll be able to recover
a more detailed record by comparing the
timing of past changes in greenhouse
gases and changes in temperature we can
improve our understanding of how human
activity is changing climate now and how
it will continue to change climate in
the future we spent three field Seasons
searching for this site and I'll take
about five field Seasons to collect all
our samples on a rare nice summer day
like this it's great to be out here Big
Sky nice ice and it's an easy ke me to
work we built this building two years
ago you can see how much it snows and
drifts around here it's already pretty
much buried come on
inside this is our drilling shelter it's
a steel Arch building and inside of it
of course we have the drill the drill is
laid out horizontally right now it's
actually a one-of-a-kind drilling tool
it's unlike any kind of water well or
oil well drill it's actually much more
of a scientific instrument than a piece
of drilling Machinery the business end
of it is right down here it has four
razor sharp Cutters the drill is moved
up into a vertical position and then
lowered down into the ice sheet this
drilling head then rotates around and
these Cutters shave off a ring of ice
the drill slips down into that ring of
ice and the core slides up into the core
Barrel
we then pull up on the core barrel and
there are little latches in here that
catch the core and we bring the core up
to the surface
[Music]
the drill work area is just a little bit
below freezing but to keep the gas
samples trapped in the ice we have to
keep the temperature of the ice core
below minus 20 C so on the other side of
the window where the core is pushed out
of the drill it's always cold we even
have a large refrigeration system to
make sure it stays cold here comes the
core we collect about 2 and2 meters of
core each time the drill goes down the
hole the core is pushed into a green
plastic net which protects the core from
damage we don't make many measurements
in the field it's just too difficult to
get the people and Equipment out here
one measurement we make back home is to
determine the isotopic ratio of the
oxygen 18 and Oxygen 16 in the water
that makes up the ice this ratio changes
depending on what the air temperature
was when the snow fell we use this
isotopic ratio to determine what the air
temperature was in the
past back home we also measure the gases
trapped in the air bubbles in the ice we
take an ice sample put it into a vacuum
chamber and crush it that releases the
trapped gases and we measure what the
concentration of greenhouse gases like
carbon dioxide was in the past this is a
thin slice of an ice core if you look at
it under special light fixture the Ice
shows up as black and the bubbles are
white the pen is pointing to the bubbles
the gas in these bubbles is a sample of
the atmosphere from when the snow was
compressed into ice we didn't come here
to study Antarctica we came here because
this is where you have to come to
determine what the concentration of
atmospheric carbon dioxide was in the
past one of the few measurements we do
make in the field is used to identify
the annual layers in the ice snow that
falls in the summer has a different
chemical composition than snow that
falls in the winter that makes the
electrical conductivity of the ice
different in different seasons so by
measuring the electrical conductivity of
the ice we can identify the annual
layers in the ice and count them to
determine how old the ice is it's sort
of like counting tree rings each Peak on
this graph is one
year the ice is packed into tubes and
boxes and moved back to the United
States using a combination of ski
equipped cargo planes ice strengthened
ships and trucks there are 30 scientists
like myself who make measurements on
this ice if you think it looks cold in
here well it is let's go outside to the
middle of Antarctica where it's warm
we'll take a walk through Camp to the
dining hall and then look at some data
we're in the suburbs now there's about
50 people here Camp everybody gets their
own tent to sleep in gives us a little
bit of private space of course we've got
a lot of room to spread out between
tents makes it kind of
[Music]
fun we take all of our waste out of the
site here we leave nothing behind about
85% of what we have we can recycle we
have wood aluminum cardboard food scraps
we don't recycle that light metal office
paper and we have some burnable
materials everything goes out with
us we use these yellow buildings as
temporary structure during the summer we
take them down every winter so they
don't get drifted in this one's the
dining hall let's get something warm to
drink
wow it's uh it's awfully busy in here I
think I think we might have to have this
conversation elsewhere let's go
outside let's take a look at some data
the data sets I'm going to show you
today do not come from the ice Cur
project that we just walked through it's
going to take us several years to make
the measurements on that ice and
interpret the results so I'm going to
show you data from another ice coring
project this graph shows the
relationship between greenhouse gases
and temperature the time span runs from
650,000 years in the past to current
time the bottom graph shows the
concentration of atmospheric CO2 during
that time and the upper graph shows how
temperatures Chang during that time the
CO2 information comes from air bubbles
in ice cores the temperature information
comes from the Isotopes stored in ice
cores what this graph shows is the
remarkable relationship between high
levels of CO2 in the atmosphere and warm
conditions and likewise the relationship
between low levels of CO2 and colder
conditions this relationship a very
tight linking between CO2 and climate
has existed for at least the last
650,000
years the other thing that this graph
shows is that the current levels of
atmospheric CO2 are very anomalous
they're much higher than they've been at
any time since at least the last 650,000
[Music]
years the data show that there's a
strong correlation between high levels
of CO2 in the atmosphere and warming
that the climate is warming today and
that humans are responsible for that
warming now I'm not going to tell you
what to do in the future about how what
sort of decisions you should make you
have to make those decisions for
yourself but my hope is that you will
use the best available science to make
those decisions so thank you for your
interest in our science and I've got to
get back to my ICE coring project and I
think the weather's going to be changing
here soon too
[Music]
[Music]
[Music]
[Music]
[Music]
[Music]
5.0 / 5 (0 votes)