Pengetahuan Peta, Pengindraan Jauh, dan Sistem Informasi Geografi (SIG) X SMA/MA
Summary
TLDRThis educational video script introduces the basics of remote sensing and Geographic Information Systems (GIS). It explains the components of a map, such as titles, edges, and legends, and delves into remote sensing techniques that use sensors to capture information from a distance. The script also covers the interpretation of images, the significance of various features like color, shape, and texture, and how GIS systems integrate and process spatial data. It concludes with a call to action for viewers to apply their newfound knowledge.
Takeaways
- 🌍 Maps are conventional representations of the Earth's surface, reduced in scale and viewed from above.
- 🏷️ Key components of a map include the title, map edges, coordinates, legend, symbols, inserts, scale, orientation, and data sources and creation date.
- 📍 The legend is crucial as it explains the symbols used on a map, while symbols represent features on the Earth's surface.
- 🔍 Inserts show the location of the mapped area in relation to surrounding areas, helping to contextualize the main mapped region.
- 📏 Scale on a map represents the ratio between distances on the map and actual distances on the Earth's surface.
- 🧭 Orientation on a map indicates direction, typically using a north arrow to show the position and direction of a point or area.
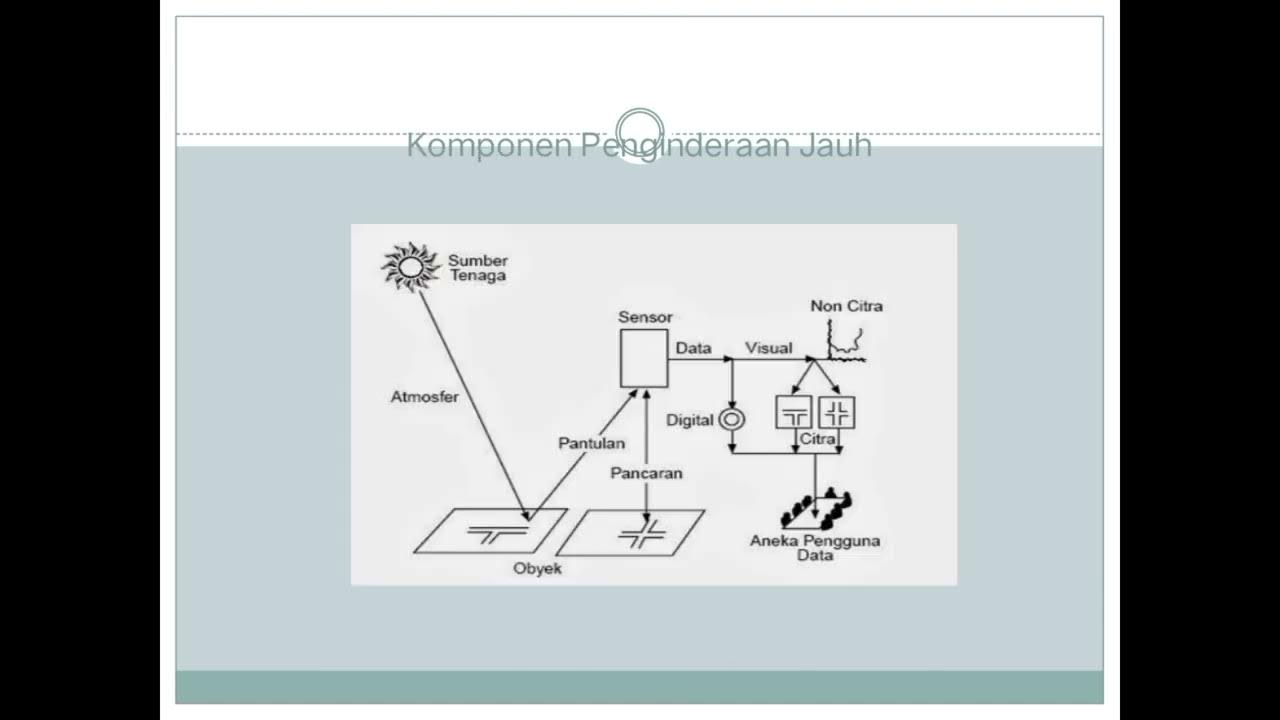
- 🌐 Remote sensing is a technique to obtain information about objects from a distance without direct contact, using sensors to record reflected or emitted energy.
- 🌞 In remote sensing, passive energy sources like sunlight are used, as opposed to active energy sources which emit their own energy.
- 🛰️ Vehicles such as balloons, airplanes, reusable spacecraft, and satellites are used to place sensors for recording in remote sensing.
- 📊 Data acquisition in remote sensing can be done manually by interpreting aerial photos visually or numerically/digitally using computers.
- 🗺️ A Geographic Information System (GIS) is a system designed for managing data with geographic references, processing imagery from remote sensing, and presenting it for analysis.
Q & A
What are the basic components of a map?
-The basic components of a map include the title, map edges, astronomical or coordinate lines, legend and symbols, insert, scale, orientation, and data sources and year of creation.
What is the purpose of the title on a map?
-The title on a map serves to describe the content and type of the map, written in capital letters.
How do coordinate lines help on a map?
-Coordinate lines help determine the location of a place on the map by providing coordinates in degrees, minutes, and seconds.
What is the function of a legend on a map?
-A legend on a map provides explanations of the symbols that are the key to understanding the map, while symbols are signs or images representing features on the Earth's surface.
What is an insert on a map?
-An insert on a map shows the position of the mapped area relative to the surrounding area, explaining the relationship between the main map area and surrounding areas.
What does the scale of a map represent?
-The scale of a map represents the ratio between the distance between two points on the map and the actual distance between those points on the Earth's surface.
What is the orientation on a map and how is it typically indicated?
-Orientation on a map is the direction indicator that shows the position and direction of a point or area, usually represented by a north arrow.
What is remote sensing and how does it work?
-Remote sensing is a technique and art of acquiring information about objects from a distance without direct contact using sensors to record objects, phenomena, or areas.
What are the two types of energy commonly used in remote sensing?
-The two types of energy commonly used in remote sensing are active and passive energy sources. Passive energy uses sunlight, while active energy emits its own signal.
What are the different types of symbols used on a map and what do they represent?
-The types of symbols used on a map include point symbols for positional data, line symbols for distance-related data, and area symbols to represent a specific area.
What is a stereoscope and how is it used in image interpretation?
-A stereoscope is a device used in image interpretation to analyze stereo images, providing depth perception to better understand the three-dimensional characteristics of the terrain.
What is a Geographic Information System (GIS) and what does it do?
-A Geographic Information System (GIS) is a system specifically for managing databases that contain geographically referenced data and information. It functions to collect, organize, process, store, and present various types of data related to the geographical conditions of an area.
What are the three main components of a GIS system?
-The three main components of a GIS system are hardware, software, and users. Hardware includes computer equipment, software includes programs for data input, processing, and output, and users are the individuals or agencies that utilize the GIS.
How does a GIS system represent the real world on a computer monitor?
-A GIS system represents the real world on a computer monitor by digitizing and processing geographical data, allowing users to visualize and analyze spatial information.
Outlines

このセクションは有料ユーザー限定です。 アクセスするには、アップグレードをお願いします。
今すぐアップグレードMindmap

このセクションは有料ユーザー限定です。 アクセスするには、アップグレードをお願いします。
今すぐアップグレードKeywords

このセクションは有料ユーザー限定です。 アクセスするには、アップグレードをお願いします。
今すぐアップグレードHighlights

このセクションは有料ユーザー限定です。 アクセスするには、アップグレードをお願いします。
今すぐアップグレードTranscripts

このセクションは有料ユーザー限定です。 アクセスするには、アップグレードをお願いします。
今すぐアップグレード関連動画をさらに表示

What is Remote Sensing and GIS?

RANGKUMAN METERI GEOGRAFI KELAS X SMA SEMESTER 1 KURIKULUM MERDEKA

Popy X 1 Dasar Pemetaan Indera SIG Geo X Regulasi Diri

Penginderaan Jauh | Geografi | Alternatifa

Sistem Informasi Geografis # kurikulum merdeka.

G.I.S (Geographic Information Systems)- Concepts, Components, Advantages + Past Paper | Grade 10-12.
5.0 / 5 (0 votes)
