How to find the domain and the range of a function given its graph (example) | Khan Academy
Summary
TLDRThe video transcript explains how to determine the domain and range of a function f(x) by analyzing its graph. The speaker walks through several examples, showing how to identify where the function is defined (domain) and what y-values it can take (range). For domain, they explain that f(x) is defined only within certain x-values, while for range, they discuss the possible y-values that f(x) can reach. The process involves understanding inequalities for both the x and y values, providing clarity through practical graph examples.
Takeaways
- 📉 The function f(x) is graphed, and we need to determine its domain.
- 🔢 The function starts being defined at x = -6, and f(-6) equals 5.
- 📏 The domain of the function is the set of x values from -6 to 7, inclusive.
- 📈 The function f(x) is defined for any x value that satisfies -6 ≤ x ≤ 7.
- 🔍 Another example shows that f(x) is not defined until x = -1, where f(-1) equals -5.
- 🧮 For the second example, the domain is -1 ≤ x ≤ 7.
- 🔢 The range of the function is determined by the set of possible y values.
- 📊 The lowest y value for f(x) is 0, and the highest is 8, giving a range of 0 ≤ f(x) ≤ 8.
- ✏️ A third example shows a domain of -2 ≤ x ≤ 5.
- 🔍 In each case, the function’s domain and range are determined based on where the function is defined and the set of corresponding y values.
Q & A
What is the domain of the function f(x) in the first example?
-The domain of the function is from x = -6 to x = 7, inclusive. This means the function is defined for all values of x where -6 ≤ x ≤ 7.
What does it mean when the function is defined between certain x-values?
-It means that for any x-value within the specified range, you can find a corresponding y-value (or f(x)). Outside this range, the function is not defined, meaning there is no corresponding y-value.
What is the value of f(x) when x = -6 in the first example?
-When x = -6, the value of f(x) is 5.
How do you determine if a function is defined for a specific x-value?
-You check the graph to see if there is a point corresponding to that x-value. If there is, the function is defined for that value; if not, the function is undefined for that x-value.
In the second example, what is the domain of f(x)?
-In the second example, the domain of f(x) is from x = -1 to x = 7, inclusive. This means the function is defined for all x-values where -1 ≤ x ≤ 7.
What is the range of the function f(x) in the third example?
-The range of the function is from 0 to 8, inclusive. This means the function takes on values of y (or f(x)) between 0 and 8, including these values.
How do you find the range of a function from its graph?
-To find the range, you look at the y-values that the function takes on across the entire domain. The lowest y-value is the minimum of the range, and the highest y-value is the maximum.
What is the significance of the y-values in the range of a function?
-The y-values in the range represent all possible outputs (f(x) values) that the function can produce based on the x-values in the domain.
In the final example, what is the domain of f(x)?
-The domain of the function in the final example is from x = -2 to x = 5, inclusive. This means the function is defined for all x-values between -2 and 5.
How does the domain differ from the range of a function?
-The domain represents all possible x-values for which the function is defined, while the range represents all possible y-values (f(x)) that the function can output.
Outlines

このセクションは有料ユーザー限定です。 アクセスするには、アップグレードをお願いします。
今すぐアップグレードMindmap

このセクションは有料ユーザー限定です。 アクセスするには、アップグレードをお願いします。
今すぐアップグレードKeywords

このセクションは有料ユーザー限定です。 アクセスするには、アップグレードをお願いします。
今すぐアップグレードHighlights

このセクションは有料ユーザー限定です。 アクセスするには、アップグレードをお願いします。
今すぐアップグレードTranscripts

このセクションは有料ユーザー限定です。 アクセスするには、アップグレードをお願いします。
今すぐアップグレード関連動画をさらに表示

Restricting domain of trig function to make invertible | Trigonometry | Khan Academy
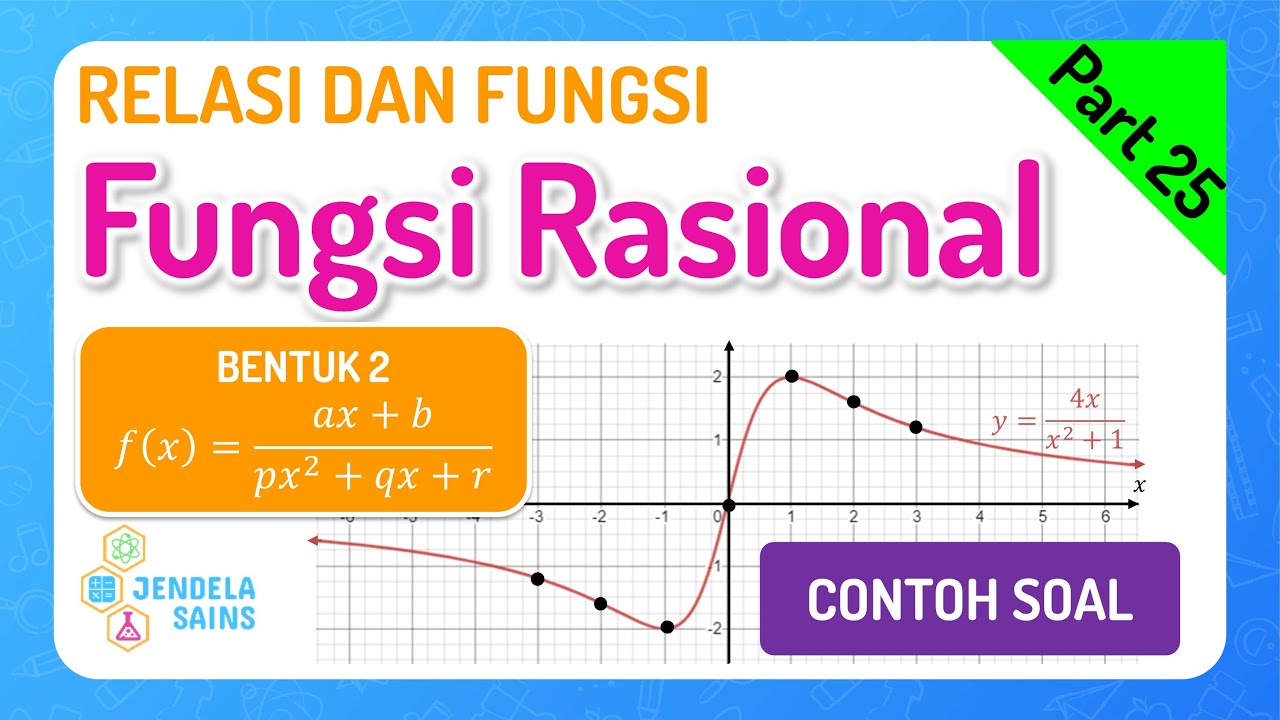
Relasi dan Fungsi Matematika Kelas 10 • Part 25: Soal Fungsi Rasional Bentuk 2 - Linear / Kuadrat
Graph f(x)=2^x
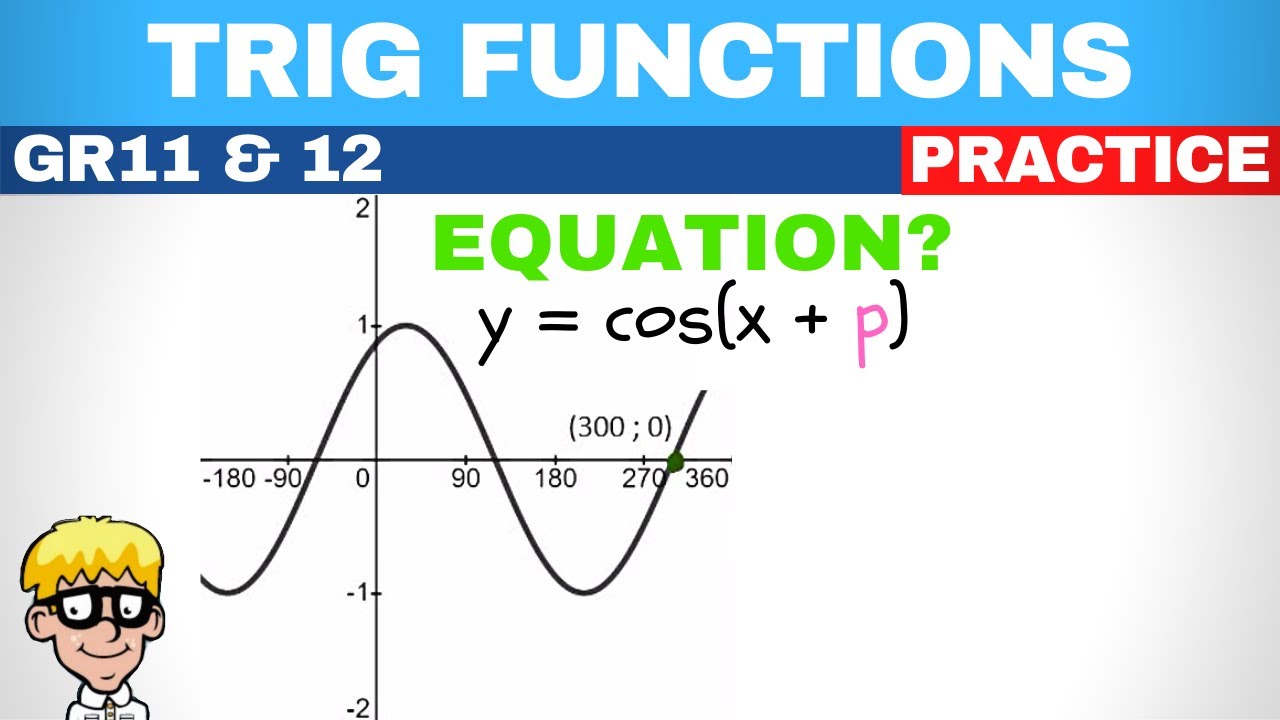
Trig functions grade 11 and 12: Determine Equation

Graph & illustrates Linear Function Find the Domain Range Table of values Intercepts & Slope Math 8
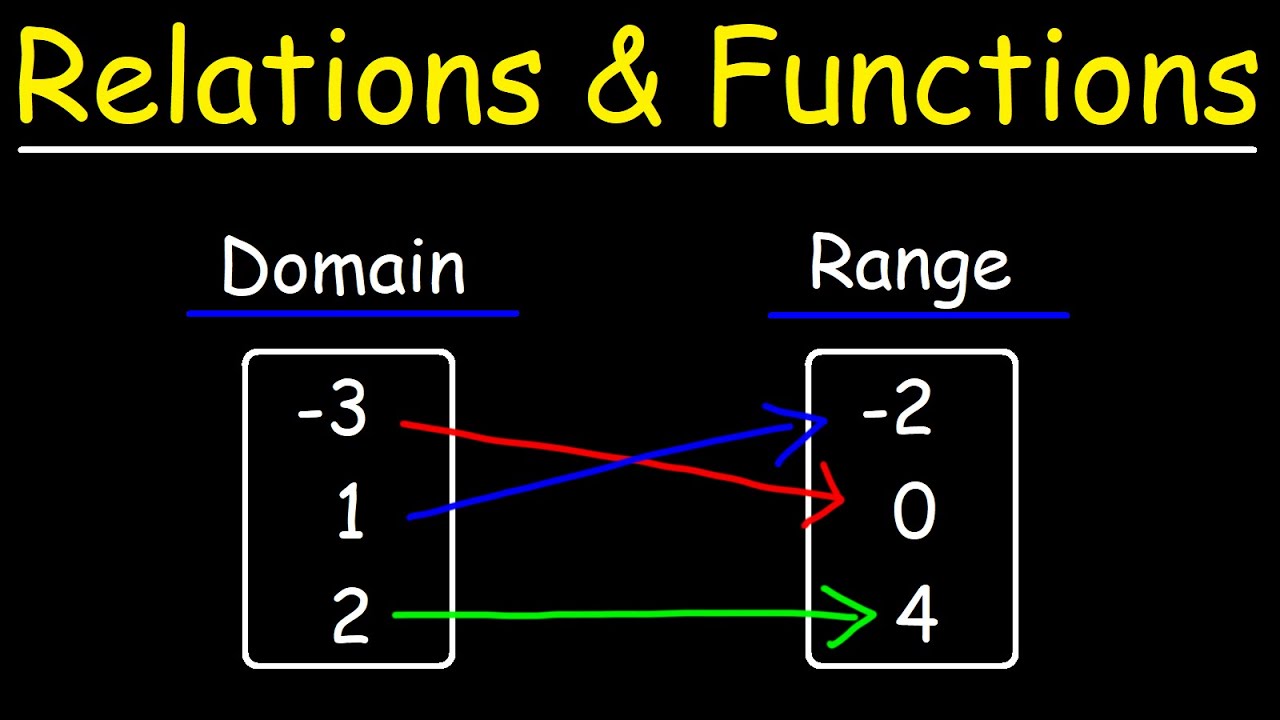
Relations and Functions | Algebra
5.0 / 5 (0 votes)
