S1.3.1 - The hydrogen emission spectrum

Cohesive Chemistry
1 Jul 202108:42

Summary

TLDRThis educational video script delves into the concept of the hydrogen emission spectrum, illustrating the behavior of light when passed through a prism versus a hydrogen gas lamp. It explains how hydrogen atoms, when excited, emit light at specific frequencies, creating a line spectrum. The script uses the Bohr model to describe electron transitions between energy levels, correlating these transitions with the observed spectral lines. It concludes by emphasizing that while some emissions are visible, others fall into the ultraviolet or infrared spectrum, invisible to the human eye.

Takeaways

  • 🌈 Light passing through a prism creates a continuous spectrum, showing all visible frequencies of light.
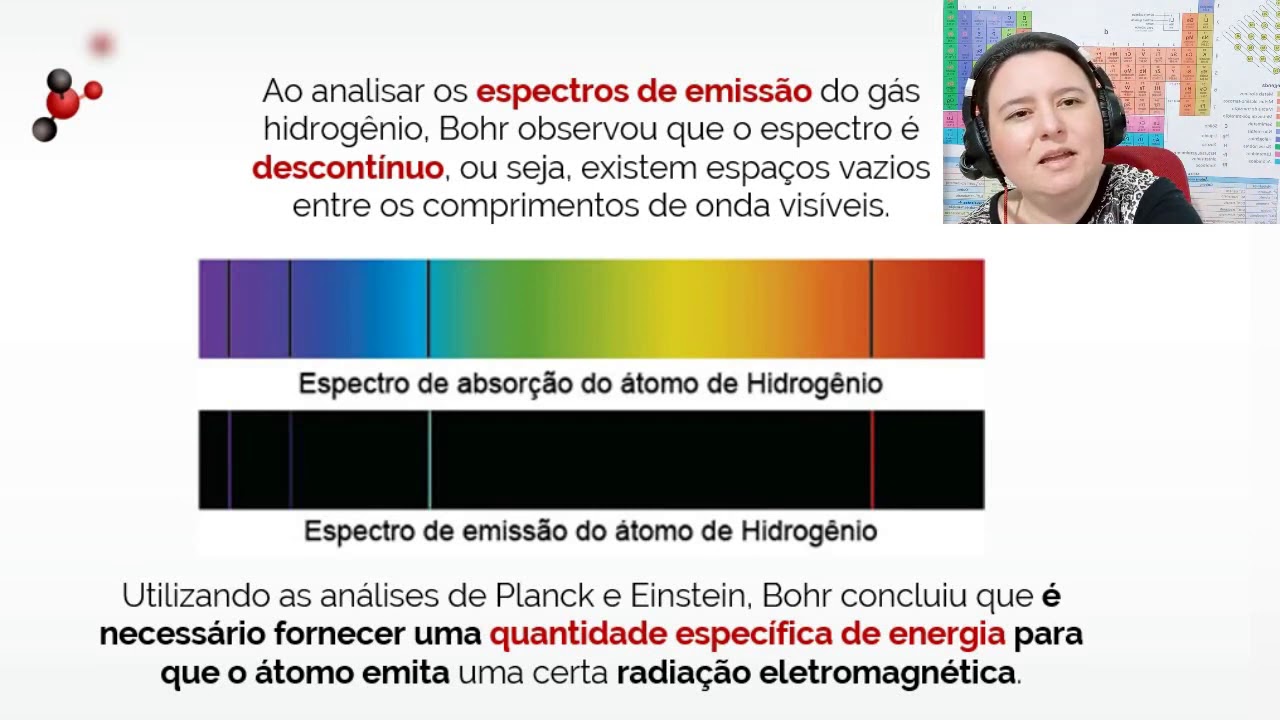
  • 💡 A hydrogen gas lamp, when excited, emits a line spectrum with specific frequencies, unlike the continuous spectrum of a light bulb.
  • 🔬 The hydrogen emission spectrum is produced by excited hydrogen atoms releasing specific frequencies of light as their electrons drop to lower energy levels.
  • 📊 The line spectrum shows discrete lines corresponding to specific energy transitions within the hydrogen atom.
  • ⚛️ The hydrogen atom model with energy levels helps explain the observed lines in the emission spectrum.
  • ⬆️ Electrons in a hydrogen atom can absorb specific frequencies of energy to jump to higher energy levels (excited states).
  • ⬇️ When electrons drop back to lower energy levels, they release the exact same amount of energy they absorbed.
  • 🔴 The red line in the hydrogen emission spectrum corresponds to the transition from the third to the second energy level.
  • 🟢 The green, blue, and violet lines represent transitions from higher energy levels (fourth, fifth, sixth) to the second energy level.
  • 🌟 The convergence of lines in the hydrogen emission spectrum suggests that energy levels in an atom get closer as they increase.

Q & A

  • What happens when white light passes through a prism?

    -When white light passes through a prism, it is refracted and split into a spectrum of colors, creating a continuous rainbow-colored spectrum that represents all the frequencies of visible light.

  • What is a continuous spectrum?

    -A continuous spectrum is one that shows all frequencies of light within a certain range, such as the visible spectrum, without any gaps.

  • How does the light emitted from a hydrogen gas lamp differ from that of a light bulb?

    -The light emitted from a hydrogen gas lamp is a line spectrum, which shows only specific frequencies of light, as opposed to the continuous spectrum produced by a light bulb.

  • Why is the word 'frequency' important when describing the hydrogen emission spectrum?

    -Using the term 'frequency' instead of 'color' is important for accuracy in scientific terminology, especially in exams, as it refers to the specific energy of the light, not just its appearance.

  • What is the ground state of a hydrogen atom?

    -The ground state of a hydrogen atom is the most stable state where its single electron is in the lowest energy level.

  • How does an electron in a hydrogen atom absorb energy?

    -An electron in a hydrogen atom absorbs a specific frequency of energy, which allows it to jump to a higher energy level, entering an excited state.

  • What happens when an electron in an excited state drops back to a lower energy level?

    -When an electron drops back to a lower energy level, it releases the exact same amount of energy it absorbed, which can be observed as light of a specific frequency.

  • How are the lines in the hydrogen emission spectrum related to the energy levels of the atom?

    -Each line in the hydrogen emission spectrum corresponds to an electron dropping from a higher energy level to a lower one, often to the second energy level, and the energy released during these drops corresponds to visible light frequencies.

  • What does the convergence of lines in the hydrogen emission spectrum suggest about the energy levels of the atom?

    -The convergence of lines in the hydrogen emission spectrum suggests that the energy levels of the atom get closer together as they increase, indicating a structure to the atom's energy levels.

  • Why are some emissions from the hydrogen atom not visible to the human eye?

    -Emissions from the hydrogen atom that involve electrons dropping to the first or third energy levels are not visible because they correspond to ultraviolet or infrared light, which are outside the range of human vision.

  • How can the energy level diagram simplify the representation of transitions in the hydrogen atom?

    -An energy level diagram simplifies the representation of transitions by showing the energy levels as horizontal lines, with the electron's jumps between levels indicated by arrows, making it easier to visualize the energy changes.

Outlines

00:00

🌈 Understanding the Hydrogen Emission Spectrum

This paragraph introduces the concept of the hydrogen emission spectrum by comparing it with the continuous spectrum of white light. The continuous spectrum is demonstrated using a prism to split white light into its constituent colors, representing different frequencies of light. In contrast, when a hydrogen gas lamp is used, the emitted light through the prism shows a line spectrum, indicating specific frequencies. This line spectrum is unique to hydrogen and is produced when hydrogen atoms are excited by energy, causing their electrons to jump to higher energy levels and then release energy as they return to lower levels. The paragraph also explains the process of electron excitation and the importance of energy level transitions in the context of the hydrogen atom's structure.

05:01

🔬 Energy Level Transitions and the Hydrogen Spectrum

The second paragraph delves into the specific energy level transitions that correspond to the lines seen in the hydrogen emission spectrum. It describes how the electron in a hydrogen atom, when excited, can jump to various higher energy levels and then drop back down, releasing energy in the form of light. The paragraph identifies the colors of the spectrum (red, green, blue, violet) with the energy level transitions, suggesting that each color represents a drop from a higher energy level to the second energy level. The explanation also touches on how the energy levels converge at higher states, which is reflected in the spectrum's lines getting closer together as energy increases. The paragraph concludes by summarizing that the hydrogen emission spectrum is a result of electrons dropping to the second energy level, with other possible transitions occurring in the ultraviolet and infrared spectra, which are not visible to the human eye.

Mindmap

Keywords

💡Hydrogen Emission Spectrum

The hydrogen emission spectrum refers to the series of bright lines seen when light emitted by hydrogen gas is passed through a prism. In the video, this spectrum is used to illustrate the quantized nature of energy levels within a hydrogen atom. Each line in the spectrum corresponds to a specific energy transition within the atom, demonstrating that electrons can only occupy certain discrete energy levels.

💡Prism

A prism is an optical device made of glass or other transparent materials with flat, polished surfaces that refract light. In the video, a prism is used to disperse white light from a light bulb into its constituent colors, creating a continuous spectrum. This process is essential for demonstrating the difference between a continuous spectrum and the discrete lines of the hydrogen emission spectrum.

💡Continuous Spectrum

A continuous spectrum is a spectrum that includes all possible frequencies of light, creating a smooth, uninterrupted band of colors. The video describes how passing white light through a prism results in a continuous spectrum, which contrasts with the discrete lines of the hydrogen emission spectrum. This concept is crucial for understanding the nature of light and the energy transitions within atoms.

💡Energy Levels

Energy levels are specific, quantized states of energy that electrons in atoms can occupy. The video explains that when energy is passed through a hydrogen atom, electrons can absorb energy and jump to higher energy levels, or drop to lower ones, emitting light in the process. The concept of energy levels is central to understanding atomic structure and the behavior of electrons.

💡Ground State

The ground state is the lowest energy state of an atom or molecule, where the electron is in its lowest possible energy level. In the video, the hydrogen atom's ground state is represented by the electron in the first energy level. This state is the most stable, and understanding it is key to explaining how atoms absorb and emit energy.

💡Excited State

An excited state is a higher energy state that an electron can reach when it absorbs energy. The video describes how electrons in hydrogen atoms can be excited by energy from electricity or heat, causing them to move to higher energy levels. The concept of excited states is essential for explaining the emission of light and the formation of the hydrogen emission spectrum.

💡Frequency

Frequency refers to the number of occurrences of a repeating event per unit of time, and in the context of light, it is related to the color or energy of the light. The video emphasizes the importance of using 'frequency' rather than 'color' when discussing the hydrogen emission spectrum, as it is a more precise term for describing the energy transitions that produce the spectrum's lines.

💡Line Spectrum

A line spectrum is a series of discrete lines that represent specific frequencies of light emitted or absorbed by an atom. In the video, the hydrogen emission spectrum is described as a line spectrum, showing only specific frequencies of light. This is in contrast to a continuous spectrum and is used to demonstrate that atoms can only emit or absorb light at certain frequencies corresponding to their energy level differences.

💡Energy Transition

An energy transition is the process by which an electron moves between different energy levels within an atom, either by absorbing or emitting energy. The video explains that when electrons in hydrogen atoms transition from higher energy levels to lower ones, they emit light at specific frequencies, resulting in the lines seen in the hydrogen emission spectrum.

💡Bohr Model

The Bohr model is a theoretical model of the atom that explains the hydrogen emission spectrum by proposing that electrons orbit the nucleus in specific, quantized energy levels. The video uses the Bohr model to explain how the emission spectrum relates to the structure of the hydrogen atom, suggesting that the energy levels converge at higher energies, which is reflected in the spectrum's converging lines.

💡UV and Infrared Spectrum

The UV (ultraviolet) and infrared spectrum are parts of the electromagnetic spectrum that are not visible to the human eye. The video mentions that emissions from energy transitions to the first energy level would be in the UV spectrum, while transitions to higher energy levels would be in the infrared. This highlights that the visible hydrogen emission spectrum is just a part of the broader spectrum of energy transitions possible in atoms.

Highlights

Light passing through a prism creates a continuous spectrum of visible light.

Hydrogen gas lamp emits a line spectrum with specific frequencies of light.

Line spectrum shows only specific frequencies, unlike the continuous spectrum.

Hydrogen emission spectrum is produced when hydrogen gas is excited by energy.

Hydrogen atom model with electron in ground state and energy levels represented.

Electrons absorb specific frequency of energy to jump to higher energy levels.

Electrons release the same amount of energy when dropping back to lower levels.

Multiple possible electron transitions in hydrogen atom due to various energy levels.

Each line in the hydrogen emission spectrum corresponds to an electron transition.

Red line in spectrum represents transition from third to second energy level.

Green line corresponds to transition from fourth to second energy level.

Blue line is due to transition from fifth to second energy level.

Violet line indicates transition from sixth to second energy level.

Energy levels in the atom converge as they move outward.

Emissions from higher energy levels to the second level are visible light.

Emissions to the first energy level would be in the UV spectrum, invisible to the eye.

Emissions to the third energy level would be in the infrared spectrum.

Emission spectra are produced by excited electrons dropping to lower levels.

Hydrogen emission spectrum suggests discrete energy levels in atoms.

Lines in the visible spectrum are due to drops to the second energy level.

Transcripts

play00:00

before we try to explain the hydrogen

play00:03

emission spectrum it's useful to think a

play00:05

little bit about

play00:06

light so let's take a light bulb

play00:10

and let's pass that light through a

play00:12

prism

play00:14

and as you can see in this diagram as my

play00:16

white light

play00:17

passes through the prism the different

play00:20

wavelengths or

play00:21

colours or frequencies of light are

play00:23

refracted

play00:25

and end up being split into a nice

play00:27

rainbow coloured spectrum

play00:30

and we're focusing here just on the

play00:32

visible part of the spectrum because

play00:34

that's the bit that we can see with our

play00:35

eyes

play00:37

now this spectrum is considered a

play00:39

continuous spectrum

play00:41

because it shows all of the frequencies

play00:43

of light

play00:44

in that visible part of the spectrum

play00:47

let's now try the same thing but instead

play00:49

of a light bulb we're going to use a

play00:51

hydrogen gas lamp

play00:54

so in my gas lamp i've got lots of

play00:56

hydrogen atoms floating around

play00:58

and what i'm going to do is pass lots of

play01:00

energy

play01:01

through my gas lamp using electricity or

play01:04

heat

play01:06

and again we're going to pass the light

play01:07

that's emitted from this gas lamp

play01:09

through a prism and it's going to look

play01:11

something like this

play01:14

so in this diagram you can see that the

play01:15

emitted light only contains

play01:17

very specific frequencies of light which

play01:21

is why we end up seeing a

play01:22

line spectrum with just single lines of

play01:25

color

play01:26

and not a continuous spectrum so a line

play01:29

spectrum

play01:30

is a spectrum that shows only specific

play01:33

frequencies of light

play01:35

and it's important to use the word

play01:36

frequency and not color

play01:38

otherwise you won't get the mark in an

play01:40

exam

play01:42

the spectrum we can see here is called

play01:44

the hydrogen emission spectrum

play01:46

because it is the line spectrum produced

play01:49

when

play01:49

a gas lamp of hydrogen is excited by

play01:52

lots of energy

play01:55

before we try and explain how those

play01:57

lines relate to the structure of an atom

play02:01

let's first think about what actually

play02:02

happens in a hydrogen atom

play02:04

when i pass lots of energy through so

play02:08

here is a

play02:09

simple ball model of a hydrogen atom

play02:12

where the nucleus would be a very small

play02:13

dot somewhere right in the middle

play02:15

and the rings are representing different

play02:18

energy levels

play02:19

we know that hydrogen has one electron

play02:22

so let's put that in the lowest

play02:24

energy level and this would be known as

play02:27

the ground state

play02:28

or the most stable state of my atom

play02:32

as i pass lots of energy through my

play02:34

hydrogen atom

play02:35

an electron can absorb a very specific

play02:38

frequency of energy

play02:39

and jump up to a higher energy level

play02:43

where the electron is now in an excited

play02:45

state

play02:48

it's important to note for the electron

play02:50

to jump up to that next energy level

play02:53

it has to absorb exactly the energy

play02:55

difference

play02:56

from the first energy level to the

play02:58

second energy level

play03:00

which is why in this process only a

play03:02

specific frequency of energy is absorbed

play03:06

conversely when that electron drops back

play03:09

down to the first energy level

play03:12

according to the conservation of energy

play03:14

it must

play03:15

release that exact same amount of energy

play03:18

to do so

play03:22

now of course because there are lots of

play03:24

different energy levels my electron

play03:26

could jump

play03:26

up to the second energy level or the

play03:28

third or fourth or fifth and so on

play03:31

and also can drop back down to any of

play03:33

the lower levels

play03:35

which means there's a number of possible

play03:36

transitions that can occur

play03:39

let's now see if we can identify the

play03:42

exact transitions that are occurring

play03:44

to produce our hydrogen emission

play03:46

spectrum that we saw earlier

play03:49

so here's the emission spectrum we saw

play03:51

from our hydrogen gas lamp earlier

play03:54

it's worth noting on here that the low

play03:56

energy end of the visible light spectrum

play03:59

is at the red side and the high energy

play04:02

end

play04:02

is at the violet side let's now draw the

play04:06

boar model of a hydrogen atom as we saw

play04:08

before

play04:10

and you can see my blue dot representing

play04:12

an electron in the ground state

play04:15

and you'll often see the energy levels

play04:17

labeled as

play04:18

n equals 1 for the first energy level

play04:22

n equals 2 for the second energy level

play04:24

and so on

play04:26

now instead of having to draw hundreds

play04:28

of circles in an exam

play04:30

we can actually simplify this diagram

play04:32

into an energy level diagram

play04:34

which is effectively taking a little

play04:36

cross section like this

play04:38

and representing it as the following

play04:43

so what ball suggested is that each of

play04:46

the frequencies or colors of light that

play04:48

i can see on my line spectrum

play04:51

represent an electron dropping from a

play04:54

higher energy level

play04:55

down to the second energy level

play04:59

now given that there are four lines on

play05:01

my hydrogen emission spectrum

play05:03

let's start with the red line which is

play05:05

the lowest

play05:06

energy or lowest frequency

play05:09

transition so i'm looking for the

play05:11

smallest gap

play05:12

or the smallest drop down to the second

play05:15

energy level

play05:17

and that's going to be a transition from

play05:18

the third energy level

play05:20

dropping down to the second if i go

play05:24

back to my hydrogen emission spectrum

play05:26

the next highest energy

play05:28

emission is the green line so that's

play05:31

going to represent the next

play05:32

biggest drop to the second energy level

play05:34

which would be from the fourth energy

play05:36

level

play05:38

the next highest energy line on my

play05:39

emission spectrum is the blue one

play05:41

which must be representing a drop from

play05:43

the fifth energy level to the second

play05:46

and finally the violet line must be

play05:49

representing a drop from the sixth

play05:50

energy level

play05:51

down to the second the brilliant thing

play05:55

about

play05:56

the ball model of the atom is that he

play05:58

looked at the emission spectrum and

play06:00

noticed that as i move from low energy

play06:02

to high energy

play06:04

emissions the lines begin to converge or

play06:07

get closer together

play06:09

and this suggested that as i move out in

play06:12

my energy levels in the atom

play06:14

the energy levels must also get closer

play06:16

together and converge

play06:18

so at some point when the energy levels

play06:20

are effectively

play06:21

in the same place we reach the edge of

play06:23

our atom

play06:26

the key point in our explanation of the

play06:28

hydrogen emission spectrum

play06:29

is that these lines are all representing

play06:32

emissions or drops

play06:34

from higher energy levels down to the

play06:37

second energy level

play06:39

because it so happens that the energy

play06:41

released in those drops

play06:43

corresponds to light on the visible part

play06:46

of the spectrum

play06:46

that we can see with our eyes however of

play06:49

course there are many other

play06:51

emissions that could occur for example

play06:54

emissions caused by electrons dropping

play06:56

back down to the first energy level

play07:00

now because the amount of energy

play07:01

released when electrons drop to the

play07:04

first energy level is much greater

play07:07

these emissions would actually be seen

play07:09

on the uv part of the spectrum

play07:10

that we can't see with our eyes

play07:14

and conversely if i think about

play07:16

electrons dropping down to the third

play07:18

energy level

play07:21

the amount of energy being released here

play07:23

is very low

play07:24

so we would expect to see it on the

play07:26

infrared part of the spectrum

play07:29

which again we can't see with our eyes

play07:32

and just like with my hydrogen emission

play07:34

spectrum

play07:35

on the visible part we would expect

play07:37

these lines to converge as well

play07:40

indicating that energy levels in an atom

play07:43

converge as we move out

play07:46

let's now try to summarize the key

play07:48

points from this video

play07:51

firstly emission spectra are produced

play07:53

when

play07:54

energy or photons are omitted by excited

play07:57

electrons

play07:58

dropping to lower energy levels

play08:02

secondly the hydrogen emissions spectrum

play08:05

suggests that electrons are found in

play08:07

discrete energy levels that converge

play08:10

at higher energies

play08:14

and thirdly lines in the visible part of

play08:16

the spectrum

play08:17

are caused by electrons dropping to the

play08:20

n equals two or

play08:21

second energy level

play08:24

any drops to the first energy level

play08:27

would be seen in the uv

play08:28

part of the spectrum

play08:31

and drops to the third energy level

play08:33

would be seen in the infrared part of

play08:35

the spectrum

play08:39

hopefully this video is of some help

Rate This

5.0 / 5 (0 votes)

関連タグ
Hydrogen SpectrumEmission SpectrumAtomic EnergyPhysics EducationLight RefractionPrism ExperimentVisible LightQuantum PhysicsEducational ContentScience Learning
英語で要約が必要ですか?