This NEW TradingView Indicator Is Better Than PREMIUM |  Best Indicator For Scalping on 5min Chart

TRADELINE
10 Feb 202408:56

Summary

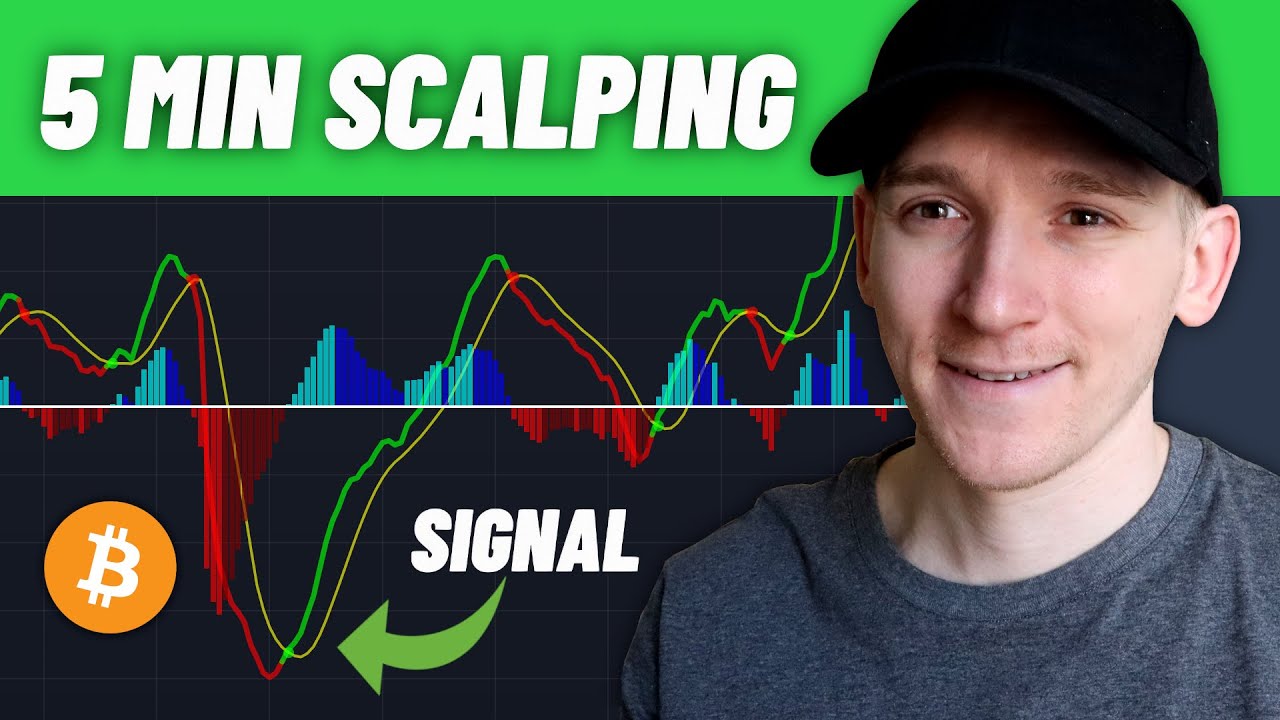
TLDRThis video introduces a unique scalping strategy for various markets, including cryptocurrencies and stocks, focusing on 5-minute charts. It reveals a secret indicator, the Triple Confirmation Kernel Regression Overlay by Quantra AI, which combines three kernel regression functions for balanced market predictions. The strategy also incorporates the Voss Predictor for enhanced entry signals. Detailed instructions on setting up the indicators and rules for entry and exit points are provided, emphasizing the importance of trend analysis and signal validation for effective trading.

Takeaways

  • 📈 The video introduces a scalping strategy using a secret indicator for 5-minute trades, emphasizing its accuracy and suitability for various markets including cryptocurrencies, stocks, futures, and major forex pairs.
  • 🔍 The strategy involves two free indicators: the Triple Confirmation Kernel Regression Overlay and the Voss Predictor, which are used to identify trends and filter out false signals.
  • 🛠️ The Triple Confirmation Kernel Regression Overlay uses three kernel regression functions to provide a balanced view of market trends, capturing complex and nonlinear relationships within financial markets.
  • 🔧 The video provides specific settings for the Triple Confirmation indicator, such as adjusting the bandwidth, standard deviation, and enabling overbought/oversold shading to maximize profits.
  • 📊 The center line of the Triple Confirmation indicator represents the long-term average trend, with the price action below indicating a bearish market and above indicating a bullish market.
  • 📌 The Voss Predictor adds a color-changing predictive filter line and dots that signal the market's momentum and direction, enhancing entry signals for trades.
  • 📝 Entry and exit rules are clearly defined for both long and short positions, including conditions for price action relative to the indicators' lines and zones.
  • 🎯 For long positions, the price must be above the white line (bullish trend), below the overbought zone, and have a bullish crossover below the center line with green dots indicating bullish momentum.
  • ❌ For short positions, the price must be below the white line (bearish trend), above the oversold zone, and have a bearish crossover above the center line with red dots indicating bearish momentum.
  • 🚫 The video script emphasizes that the strategy is for demonstration purposes and should not be taken as financial advice, urging viewers to use the information responsibly.
  • 👍 The presenter encourages viewers to subscribe to the channel for more informative content, highlighting the educational value of the video.

Q & A

  • What is the main topic of the video?

    -The main topic of the video is a scalping strategy using a secret indicator for trading in various markets, including cryptocurrencies, stocks, futures, and major Forex pairs.

  • What is the time frame that the strategy is best suited for?

    -The strategy is best suited for 5-minute and 15-minute time frames, although it can also be effective on longer time frames such as 1 hour and 4 hours.

  • What is the first indicator mentioned in the video and what does it do?

    -The first indicator mentioned is the 'triple confirmation kernel regression overlay' created by quantra AI. It uses three different kernel regression functions to calculate a balanced and smooth composite of the regressions.

  • What is kernel regression and how is it used in trading?

    -Kernel regression is a non-parametric machine learning algorithm that fits curves to a given data set by combining historical market data. It is used to make informed predictions and gain insights into market trends, especially capturing complex and nonlinear relationships.

  • What are the three kernel regression functions used in the triple confirmation indicator?

    -The three kernel regression functions are the Parzen, Wave, and Logistic kernel regressions, each with different methods of assigning weights to data points based on their distance from the target point.

  • How should the bandwidth and standard deviation be adjusted in the indicator settings for optimal results?

    -The bandwidth should be changed to 75 and the standard deviation extreme from 3 to 2 for optimal results in the market.

  • What does the white line in the triple confirmation indicator represent?

    -The white line in the triple confirmation indicator represents the long-term average trend. If the price action is trading below this line, it indicates a potential bearish market and downtrend.

  • What is the significance of the purple and blue channels in the indicator?

    -The purple upper channel signifies an overbought market condition, while the blue lower channel indicates an oversold market condition.

  • What is the second indicator added to enhance entry signals and what does it do?

    -The second indicator is the 'Voss predictor'. It has a color-changing filter line that, when it crosses over or under a white band pass filter line, signifies buy or sell signals depending on its position relative to the center line.

  • What are the conditions for entering a long position according to the strategy?

    -To enter a long position, the price action must be trading above the white line (indicating a bullish trend), below the overbought zone, with a bullish crossover below the center line, and the center line dots green.

  • What are the conditions for entering a short position according to the strategy?

    -To enter a short position, the price action must be trading below the white line (indicating a bearish trend), above the oversold zone, with a bearish crossover above the center line, and the center line dots red.

  • How should the stop loss and take profit be set for trades based on the strategy?

    -The stop loss should be set just below the blue shading or at the white line for long trades, and just above the purple shading or at the white line for short trades. The take profit should aim to be two times greater than the stop loss.

  • What is the disclaimer regarding the strategy presented in the video?

    -The strategy is for demonstration purposes only and should not be taken as financial advice. It is for informational purposes, and viewers should not rely solely on this information for trading.

Outlines

00:00

📈 Introduction to a Scalping Strategy with Secret Indicator

The video script introduces a scalping strategy that is claimed to be highly accurate for 5-minute trading. It reveals a lesser-known indicator, the Triple Confirmation Kernel Regression Overlay by quantra AI, which uses three separate kernel regression functions to smooth data and predict market trends. The strategy is applicable to various markets, including cryptocurrencies, stocks, futures, and major forex pairs, with the best time frames being 5 and 15 minutes. The script explains how to set up the indicator, adjust its settings for profit maximization, and interpret its signals, including the center line, upper and lower channels, and color-changing shading for short-term trends. Additionally, the Voss Predictor is introduced to enhance entry signals, with its color-changing filter line and dots indicating market momentum.

05:01

📉 Entry and Exit Rules for Scalping Strategy

This section of the script outlines the specific rules for entering long and short positions using the described scalping strategy. For a long position, the price must be above the white line (indicating a bullish trend) and below the overbought zone. A bullish crossover below the center line and green center line dots confirm a valid buy signal. Conversely, for a short position, the price should be below the white line (indicating a bearish trend) and above the oversold zone, with a bearish crossover above the center line and red center line dots. The script provides examples of valid and invalid signals, emphasizing the importance of following the entry and exit rules. It also includes a reminder that the strategy is for informational purposes only and should not be considered financial advice.

Mindmap

Keywords

💡Scalping Strategy

A scalping strategy in trading refers to a method used by traders to make profits from small price changes in the market. This strategy is typically employed for quick trades with the aim of accumulating small profits over time. In the context of the video, the scalping strategy is focused on using a secret indicator to capitalize on 5-minute trades, highlighting its applicability in fast-paced trading environments.

💡Kernel Regression

Kernel regression is a non-parametric technique used in statistics and machine learning to estimate the conditional expectation of a random variable. It involves fitting a curve to a given data set by assigning weights to data points based on their proximity to the target point. In the video, kernel regression is used by the 'triple confirmation' indicator to smooth data and capture complex market trends, which is crucial for making informed trading decisions.

💡Triple Confirmation Kernel Regression Overlay

This is a specific type of indicator used in trading platforms that combines three different kernel regression functions to provide a balanced and smooth composite of the regressions. It is mentioned in the video as a 'super cool tool' that helps in making predictions and gaining insights into market trends. The indicator plays a central role in the scalping strategy being discussed, as it aids in identifying potential trading opportunities.

💡Overbought/Oversold

In trading, 'overbought' and 'oversold' are terms used to describe a security's price level relative to its true value. A security is considered overbought when its price is believed to be too high, and it is likely to decrease soon. Conversely, it is considered oversold when its price is believed to be too low, and it is likely to increase. In the video, these terms are used to identify market conditions that can signal potential entry or exit points for trades.

💡Voss Predictor

The Voss Predictor is an indicator used in trading to predict future price movements based on historical data. It is mentioned in the video as an additional tool to enhance entry signals in the scalping strategy. The indicator uses a color-changing line that, when it crosses over a certain threshold, can signal a buy or sell opportunity, depending on the context of the market conditions.

💡Center Line

In the context of the video, the center line represents the long-term average trend of the market. It is a key reference point in the scalping strategy, as it helps traders determine the overall market trend (bullish or bearish). The video explains that when the price action is below the center line, it indicates a potential bearish market, and when above, it indicates a potential bullish market.

💡Bullish/Bearish Momentum

Bullish momentum refers to a situation in the market where asset prices are rising or are expected to rise, indicating optimism among investors. Conversely, bearish momentum indicates a market where prices are falling or are expected to fall, reflecting pessimism. In the video, the color of the dots on the center line is used to indicate the current momentum, with green signifying bullish and red signifying bearish, guiding traders on when to enter long or short positions.

💡Stop Loss

A stop loss is an order placed with a broker to sell a security when it reaches a certain price. It is designed to limit an investor's loss on a position. In the video, setting a stop loss is part of the trading strategy, with the recommendation to place it at a certain level relative to the market conditions (either above a certain shading or below the center line) to manage risk effectively.

💡Take Profit

Take profit is an order placed to sell a security when it reaches a certain price, aiming to lock in a profit. It is a strategy used to secure gains and is part of risk management in trading. The video suggests setting the take profit at a level that is two times greater than the stop loss, which is a common rule of thumb to ensure that the potential profit outweighs the risk.

💡False Signals

False signals in trading refer to market indicators that suggest a particular action should be taken, but the anticipated price movement does not occur. In the video, the presenter discusses methods to filter out these false signals to improve the accuracy of the scalping strategy. This is important for traders to avoid making decisions based on misleading market data.

Highlights

Introduction of a mind-blowing scalping strategy for 5-minute trading.

The strategy uses a secret indicator that is not widely known.

Applicability of the strategy to various markets including cryptocurrencies, stocks, futures, and major Forex pairs.

Recommendation of 5-minute and 15-minute time frames for the strategy.

Introduction of the first indicator: Triple Confirmation Kernel Regression Overlay by quantra AI.

Explanation of Kernel Regression as a non-parametric machine learning algorithm.

Description of the three separate kernel regression functions used in the indicator.

Adjustment recommendations for the Triple Confirmation Kernel Regression indicator settings.

Explanation of the center line's significance in identifying long-term average trends.

Identification of overbought and oversold market conditions using color channels.

Introduction of the second indicator: Voss Predictor for enhancing entry signals.

Description of the Voss Predictive Filter Line and its role in generating buy and sell signals.

Importance of the color-changing dots in the Voss Predictor for identifying market momentum.

Entry rules for long positions including price action conditions and indicator signals.

Entry rules for short positions including opposite conditions to long positions.

Exit strategy involving setting stop loss and take profit based on specific rules.

Examples of applying the strategy to real market scenarios with visual demonstrations.

Disclaimer that the strategy is for informational purposes and not financial advice.

Encouragement to subscribe for more trading strategy videos.

Transcripts

play00:00

hey everyone welcome back to our channel

play00:02

in this video I'm going to share with

play00:03

you a mind-blowing scalping strategy

play00:05

that I just recently found and it's a

play00:07

secret indicator that not many people

play00:09

know about and it's pretty cool so in

play00:11

this video I'll be revealing this

play00:12

strategy and showing you how to set it

play00:14

up trust me it's perfect for 5 minute

play00:16

scalping and it's incredibly accurate

play00:18

and I'll also show you guys how to

play00:20

filter out some of the false signals so

play00:22

stay tuned Until the End okay so let's

play00:24

get straight into it it is important to

play00:26

note that this trading strategy can be

play00:27

applied to various markets including

play00:29

crypto currencies stocks Futures and

play00:31

major Forks pairs the best time frames

play00:34

to use are 5 minutes and 15 minutes

play00:36

although the strategy can also be

play00:38

effective on longer time frames such as

play00:40

1 hour and 4 hours currently I am

play00:42

viewing the Euro USD chart in the 5

play00:44

minute time frame the trading method I'm

play00:46

about to show you consists of two free

play00:47

indicators all right let's first add the

play00:50

indicator to the chart to add indicators

play00:52

simply click on the indicator menu

play00:53

located at the top then in the search

play00:56

menu type the name of the first

play00:57

indicator which is the triple

play00:59

confirmation

play01:02

and it's this one triple confirmation

play01:04

kernel regression overlay created by

play01:06

quantra AI click on it to add it to the

play01:09

Chart this indicator is a super cool

play01:11

tool that uses not one not two but three

play01:14

different kernel regression functions to

play01:15

calculate a super balanced and smooth

play01:17

composite of the regressions if you

play01:19

don't know how the kernel regression

play01:20

works let me give you a short

play01:22

explanation kernel regression is a

play01:23

non-parametric machine learning

play01:25

algorithm that operates by fitting

play01:26

curves to a given data set by combining

play01:29

historical Market data with the power of

play01:31

Kernel regression we can make informed

play01:33

predictions and gain valuable insights

play01:34

into market trends this technique has

play01:36

proven particularly effective in

play01:38

capturing complex and nonlinear

play01:40

relationships within financial markets

play01:42

the triple confirmation kernel

play01:43

regression indicator utilizes three

play01:45

separate kernel regression functions

play01:47

first the app nikov kernel regression

play01:49

known for its exceptional ability to

play01:51

smooth data this method assigns less

play01:53

weight to data points that are farther

play01:54

away from the target Point effectively

play01:56

minimizing variance second the wave

play01:59

kernel regression similar to the EP

play02:01

nikov method this approach assigns

play02:02

weight to data points based on their

play02:04

proximity enabling it to capture

play02:06

repetitive patterns and wave like Trends

play02:07

within the data consequently it

play02:09

effectively smoothens out the impact of

play02:11

underlying cyclical Trends and third the

play02:13

logistic kernel regression this uses the

play02:16

logistic function in order to assign

play02:17

weights by probability distribution on

play02:19

the distance between data points and

play02:21

Target points it thus avoids both bias

play02:23

and variance to a certain level now

play02:26

let's make some tweaks to this indicator

play02:28

to maximize our profits in the Market

play02:30

when you head over to the indicator

play02:31

settings panel I recommend making a few

play02:33

adjustments in the input section change

play02:35

the bandwidth to 75 which is the length

play02:37

of the kernel regression calculation and

play02:40

standard deviation extreme from 3 to

play02:42

2 and then tick the overbought oversold

play02:45

shading and in the style section and TI

play02:47

the bar color once you're done click on

play02:49

okay to save the changes here this white

play02:52

line is the center line which represents

play02:54

the long-term average Trend when the

play02:56

price action is trading below this

play02:57

Center Line it indicates a potential

play02:59

bearish market and a downtrend

play03:01

consequently during a downtrend our

play03:03

Focus will solely be on identifying

play03:04

selling opportunities and when the price

play03:07

action is trading above the center line

play03:08

it indicates a potential bullish market

play03:11

and an uptrend consequently during an

play03:13

uptrend our Focus will solely be on

play03:15

identifying buying opportunities above

play03:17

the center line there is a distinct

play03:18

purple upper Channel when the price

play03:20

approaches or enters this upper Channel

play03:22

it signifies an overbought Market

play03:24

condition conversely below the center

play03:25

line there exists a lower Channel

play03:27

resembling a shade of blue although I am

play03:29

un certain of the exact name of this

play03:31

color for this video I will refer to it

play03:33

as blue so when the price enters or

play03:35

approaches this lower Channel it

play03:36

indicates an oversold Market condition

play03:38

next we have this color changing shading

play03:40

that moves along with the price giving

play03:42

us valuable insights into the short-term

play03:44

trends of the market when it turns blue

play03:46

it indicates an uptrend and when it

play03:48

changes to purple it indicates a

play03:49

downtrend all right now let's take it up

play03:51

a notch and add an additional indicator

play03:53

to enhance our entry signals to apply

play03:55

the indicator simply go to the indicator

play03:57

section and type Voss predictor in the

play03:59

the search

play04:03

box and select this first one Voss

play04:06

predictor click on it to added to the

play04:10

Chart this line here that changes color

play04:12

between green and red is the Voss

play04:14

predictive filter line and the white

play04:16

line represents a band pass filter when

play04:18

the Voss predictive filter line crosses

play04:20

over the white line it signifies a Buy

play04:22

Signal however for this by signal to be

play04:24

valid the crossover must occur below the

play04:26

center line similarly when the Voss

play04:28

predictive filter line crosses under the

play04:30

white line it indicates a cell signal

play04:32

and the crossover should happen above

play04:33

the center line additionally we have

play04:35

these dots located in the middle of the

play04:37

indicator that change color the color of

play04:39

these dots holds significant importance

play04:41

as it reveals the current momentum and

play04:42

direction of the market when the dots

play04:44

turn red it indicates bearish momentum

play04:46

in such cases we solely focus on bearish

play04:49

crossovers that occur above the center

play04:51

line which indicate a cell signal

play04:53

conversely when these dots turn green it

play04:55

signifies bullish momentum and we only

play04:57

seek bullish crossovers below the center

play04:58

line which indicate a Buy Signal now

play05:01

that we've covered the foundation of our

play05:02

strategy let's move on to the entry and

play05:04

exit rules let's begin with the rules

play05:06

for entering long positions first the

play05:09

price action must be trading above the

play05:11

white line which indicates a bullish

play05:13

Trend however it is equally important

play05:15

that the price remain below the

play05:16

overbought Zone moving on to the second

play05:18

indicator we should look for bullish

play05:20

crossovers below the center line

play05:22

additionally the center line dots should

play05:23

also be green further supporting the

play05:25

bullish Trend if all of these conditions

play05:27

are met you can take a long position we

play05:29

will open a long order at the opening of

play05:31

the next candle you can place your stop

play05:33

loss just below this blue shading or at

play05:35

the white line as for your Target aim

play05:37

for a profit that is two times greater

play05:38

than your stop

play05:41

loss now let's understand the conditions

play05:43

for entering a short trade entering a

play05:45

short position is the exact opposite of

play05:47

entering a long position first the price

play05:49

action must be trading below the white

play05:51

line which indicates a bearish trend

play05:54

however at the same time it should be

play05:55

above the oversold Zone next down here

play05:58

we should look for bearish crossovers

play06:00

above the center line Additionally the

play06:02

center line dots should also be red

play06:03

further supporting the bearish trend if

play06:05

all of these conditions are met you can

play06:07

take a short position we will open a

play06:09

short order at the opening of the next

play06:10

candle you can place your stop loss just

play06:13

above this purple shading or at the

play06:15

white line as for your Target aim for a

play06:17

profit that is two times greater than

play06:18

your stop

play06:20

loss let's look at some examples to help

play06:22

you understand as you can see here the

play06:24

price is trading above the white line

play06:26

indicating a bullish Trend additionally

play06:29

it is below the overbought Zone moving

play06:31

on we have a bullish crossover below the

play06:33

center line which serves as a buying

play06:35

signal moreover the center line dots

play06:37

have already turned green further

play06:38

supporting the bullish Trend so all the

play06:40

rules are met on this candle we will

play06:42

enter a long trade at the opening of the

play06:44

next candle I set the stop loss just

play06:46

below the blue shading and our take

play06:48

profit would be two times greater than

play06:49

the stop

play06:52

loss here we have a bullish crossover

play06:54

below the center line which indicates a

play06:56

Buy Signal additionally the price is

play06:58

below the over over bot Zone and above

play07:00

the white line further confirming a

play07:02

bullish Trend however it's important to

play07:04

note that the center line dots are red

play07:06

indicating a bearish trend so this Buy

play07:08

Signal is not valid let's see some more

play07:13

examples here the price is trading below

play07:16

the white line indicating a bearish

play07:17

trend additionally it is above the

play07:19

oversold Zone moving on we have a

play07:22

bearish crossover above the center line

play07:24

which serves as a selling signal

play07:26

moreover the center line dots have

play07:27

already turned red further supp

play07:29

according the bearish trend so all the

play07:31

rules are met on this candle we will

play07:33

enter a short trade at the opening of

play07:34

the next candle I set the stop loss just

play07:36

above the white line and our take profit

play07:38

would be two times greater than the stop

play07:42

loss here we have another bullish

play07:44

crossover above the center line which

play07:45

indicates a sell signal the price is

play07:48

trading below the white line indicating

play07:50

a bearish trend additionally it is above

play07:52

the oversold Zone furthermore the center

play07:54

line Dots here are also red supporting

play07:56

the bearish trend so all the rules are

play07:58

met on this this candle we will enter a

play08:00

short trade at the opening of the next

play08:02

candle I set the stop loss just above

play08:04

the white line and as you can see our

play08:06

stop loss is hid in this

play08:08

trade here the price is trading above

play08:10

the white line indicating a bullish

play08:12

Trend additionally it is below the

play08:14

overbought Zone moving on we have a

play08:16

bullish crossover below the center line

play08:18

which serves as a buying signal moreover

play08:21

the center line dots have already turned

play08:22

green further supporting the bullish

play08:24

Trend so all the rules are met on this

play08:26

candle we will enter a long trade at the

play08:28

opening of the next handle I set the

play08:30

stop loss just below the white line and

play08:32

our take profit would be two times

play08:33

greater than the stop loss please

play08:36

remember that the strategy shown in this

play08:38

video is to demonstrate the indicators

play08:39

and how to use them not extensively

play08:41

backed again nothing in this video

play08:44

should be taken as Financial advice this

play08:46

is purely for informational purposes so

play08:48

thank you guys for watching and if you

play08:49

like the video then be sure to subscribe

play08:51

to our channel so that you don't miss on

play08:53

any of our new videos I'll see you in

play08:55

the next video

Rate This

5.0 / 5 (0 votes)

関連タグ
Scalping StrategyTrading TipsKernel RegressionMarket AnalysisTechnical AnalysisCrypto TradingStock MarketForex PairsIndicator SetupTrading SignalsFinancial Markets
英語で要約が必要ですか?