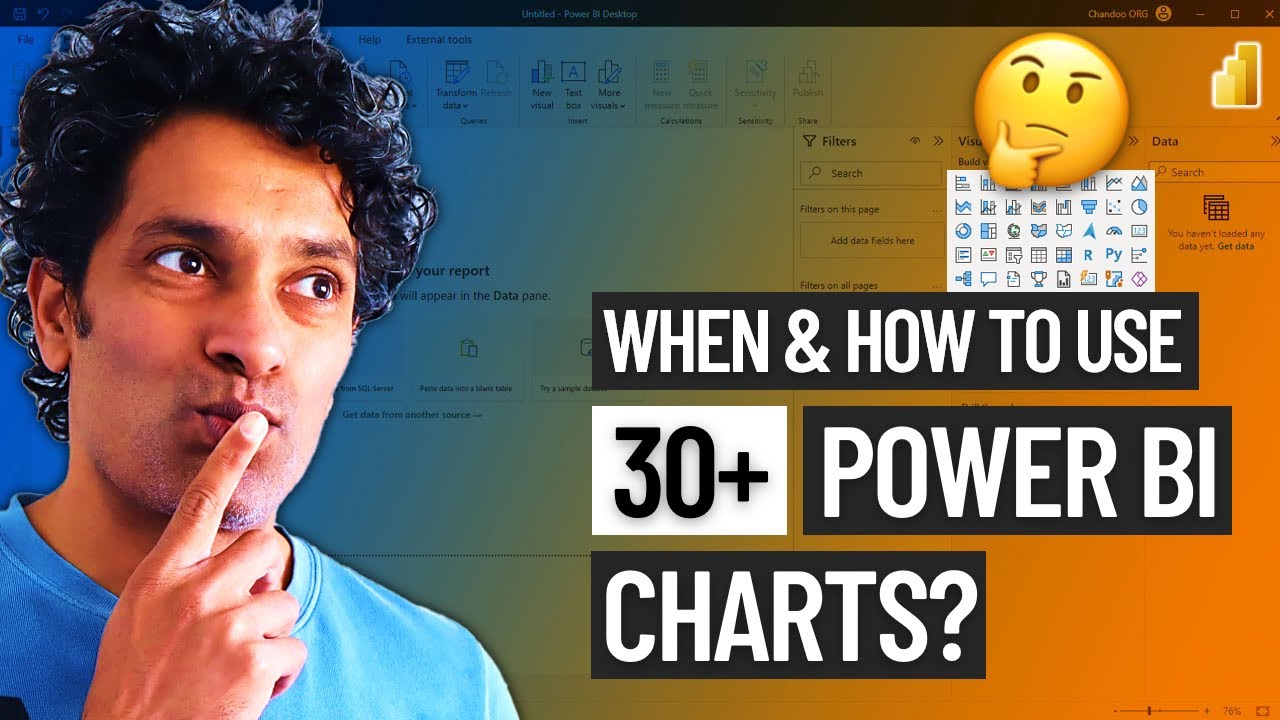
Power BI Update - June 2024

Microsoft Power BI
12 Jun 202412:20

Summary

TLDRThe June Power BI update introduces Scatter plots in visual calcs, a new 'lookup' function, and enhanced accessibility with 'Show Visuals as Table'. It also marks the general availability of Power BI Home and Desktop updates for easier report creation. Significant developments include the ability to download large semantic models as PBIX files and the introduction of the enhanced report format PBIR for source control-friendly file management. New DAX functions and the capability to use DAX Query View while live connected to a semantic model are also highlighted. The update emphasizes improved mobile app accessibility and developer efficiency with the PBIR format.

Takeaways

  • 📊 Scatter Plots in Visual Calcs: Power BI now supports scatter plots within visual calcs, allowing users to add a visual calc to a scatter plot, though the play axis is not yet supported.
  • 🖍️ Editing Highlight in Visual Matrix: A new highlight feature has been added to the visual matrix to indicate which visual calc is being edited, aiming to simplify the editing process in the future.
  • 🔍 New Lookup Function: A new visual calc exclusive function called 'lookup' has been introduced to easily find values in the visual matrix by specifying a filter value.
  • 🏠 General Availability of Power BI Home and Desktop: Enhancements to Power BI Home and Desktop are now generally available, making it easier for users to create reports with improved discoverability features.
  • 📈 Downloading Large Semantic Models: Users can now download large semantic models to Power BI Desktop as a PBIX file, enabling an end-to-end authoring experience for such models.
  • 📚 New Info Functions: June 2024 brings new info functions, which are DAX function versions of existing analysis services DMVs, with the ability to take optional input parameters called restrictions.
  • 🔬 DAX Query View Live Connection: The ability to use DAX Query View while live connected to a published semantic model has been added, allowing for quick data viewing without creating visuals.
  • 📲 Power BI Mobile Accessibility: The mobile app now includes a 'Show Visuals as Table' feature, enhancing the experience for screen reader users and those who prefer tabular data consumption.
  • 🛠️ Power BI Developer Mode Enhancements: The introduction of the Power BI enhanced report format PBIR for Power BI Project Files (PBIP) marks a milestone in providing source control friendly file formats for co-development.
  • 🌐 New Visuals in AppSource: New visuals available in AppSource include Word Cloud by Powerviz, Drill Down Timeline PRO by ZoomCharts, Attribute Control Chart by Nova Silva, and Download Button by JTA.
  • 📁 Paginated Reports in Folders: Users can now open and publish paginated reports that are located in folders and subfolders within Power BI Report Builder and the Power BI service.

Q & A

  • Who is the presenter of the June edition of the Power BI monthly update?

    -The presenter is Jason Himmelstein, the principal PM manager for content strategy and Microsoft Fabric.

  • What new feature has been added to visual calcs in Power BI reporting?

    -Scatter plots are now supported within visual calcs, allowing users to add a visual calc to a scatter plot, though the play axis is not yet supported.

  • What is the new function exclusive to visual calcs called?

    -The new function is called 'lookup', which makes it easy to find values in the visual matrix by specifying a filter value on any axis.

  • What update has been made to the Power BI Home and Power BI Desktop?

    -The new Power BI Home and Power BI Desktop are now generally available, introduced with functionalities that make it easier for users to create reports, including data sources accessible from the home screen and enhanced digital discoverability features.

  • What significant change has been announced for Power BI modeling?

    -Users can now download large semantic models to Power BI Desktop as a PBIX file, unlocking the end-to-end authoring experience for large semantic models in Power BI Desktop.

  • What new capabilities have been added to the info functions in June 2024?

    -New info functions are now available, all of which are DAX function versions of existing analysis services DMVs, and they can take optional input parameters called restrictions.

  • How has the ability to use DAX Query View been enhanced?

    -The ability to use DAX Query View has been added while live connected to a published semantic model, allowing users to write DAX queries with DAX Query View in Power BI Desktop.

  • What new accessibility feature has been added to the Power BI mobile app?

    -The 'Show Visuals as Table' feature has been added, allowing users to view all visuals in a report as table visuals, enhancing the consumption experience for users who rely on screen readers or prefer tabular data.

Outlines

00:00

📊 Power BI June Update Overview

The June edition of the Power BI monthly update introduces several enhancements and new features. Jason Himmelstein, principal PM manager, presents updates on Power BI reporting, visual calculations, and the new Power BI Home and Desktop. Scatter plots can now be integrated with visual calcs, and a new 'lookup' function is introduced for easier value filtering in the visual matrix. The update also includes improved accessibility with the 'Show Visuals as Table' feature for Power BI mobile, and a significant milestone with the introduction of the Power BI enhanced report format (PBIR) for Power BI Project Files (PBIP), facilitating source control-friendly file formats and co-development.

05:02

🔍 Deep Dive into Power BI Enhanced Report Format

Rui Romano provides a detailed demonstration of the Power BI enhanced report format (PBIR), which aims to improve the source control and co-development experience. PBIR allows for granular tracking of report changes and supports the reuse of pages and bookmarks across reports. It introduces a public and documented report format, making it easier to understand changes and minimize merge conflicts. The demo showcases how to navigate the PBIR folder, utilize adjacent schema for property understanding and syntax validation, and use version control tools like VSCode and git to track and manage changes efficiently.

10:06

🌟 Community Spotlight and Additional Updates

The script concludes with a spotlight on community member Rubayat Yasmin for her contributions to the Power BI community, including authoring solutions and moderating sessions. It also mentions new visuals available in AppSource and updates to Power BI paginated reports, allowing users to access and publish reports in folders and subfolders. The update encourages community engagement through the Power BI Community forums and invites feedback for continuous improvement.

Mindmap

Keywords

💡Power BI

Power BI is a suite of business analytics tools developed by Microsoft, used for data visualization and business intelligence. It is central to the video's theme as it discusses updates and new features for Power BI users. For example, the script mentions the 'Power BI monthly update' and 'Power BI Desktop,' highlighting the ongoing development and improvements to the tool.

💡Visual Calcs

Visual Calcs is a feature within Power BI that allows users to create custom calculations that can be visualized in various图表 formats. The script introduces an update to Visual Calcs, including the support for scatter plots, which is significant for users who need to perform more complex data analysis and visualization.

💡Scatter Plots

A scatter plot is a type of chart used to display values for typically two variables for a set of data. In the context of the video, the introduction of scatter plot support within Visual Calcs is a new feature that expands the types of data visualizations available in Power BI, as mentioned when Jason Himmelstein discusses the update.

💡Lookup Function

The lookup function is a new feature in Power BI's visual calcs that facilitates finding values within the visual matrix by specifying a filter. It is an important addition for users who need to perform more targeted data analysis, as it allows for more precise control over the data being visualized, as illustrated in the script when discussing the new visual calc exclusive function.

💡Power BI Home

Power BI Home is the central location within the Power BI service where users can access their reports, dashboards, and other content. The script mentions the general availability of the new Power BI Home and Power BI Desktop, which brings enhancements to make report creation more accessible and straightforward.

💡Semantic Models

In Power BI, a semantic model represents the structure of the data, including relationships and hierarchies. The script discusses the ability to download large semantic models as a PBIX file, which is a significant feature for users who work with complex data sets, as it enables end-to-end authoring within Power BI Desktop.

💡DAX Functions

DAX (Data Analysis Expressions) is a formula language used in Power BI for creating calculated measures and columns. The script introduces new info functions in DAX that are versions of existing analysis services DMVs, which allow for more detailed and flexible data analysis within Power BI.

💡DAX Query View

DAX Query View is a feature in Power BI that allows users to write and analyze DAX queries. The script mentions the addition of the ability to use DAX Query View while live connected to a published semantic model, which is a significant enhancement for users who need to perform real-time data analysis without creating visuals.

💡Show Visuals as Table

Show Visuals as Table is a new feature in the Power BI mobile app that allows users to view all visuals in a report as table visuals. This update is particularly beneficial for accessibility, as it enables users who rely on screen readers to consume data more effectively, as well as those who prefer tabular data presentation.

💡PBIR (Power BI Enhanced Report Format)

PBIR stands for Power BI Enhanced Report Format, which is a new file format for Power BI Project Files (PBIP). The script discusses the introduction of PBIR as a milestone for Power BI development, as it provides source control-friendly formats that facilitate co-development and improve development efficiency, allowing for better tracking of changes and reuse of report objects.

💡AppSource

AppSource is the marketplace for Microsoft 365 where users can find and add apps, services, and add-ins to enhance their productivity. In the context of the video, it is mentioned as a place where new Power BI visuals are available, expanding the capabilities of Power BI reports and dashboards.

💡Paginated Reports

Paginated reports in Power BI are fixed-layout reports that are designed for printing or for distributing as PDFs. The script mentions an update that allows users to open and publish paginated reports that are located in folders and subfolders, providing greater flexibility and organization for report management.

💡Spotlight Member

The Spotlight Member is a feature of the Power BI community where a member is highlighted for their positive contributions. In the script, Rubayat Yasmin is introduced as the spotlight member for her active participation, authoring solutions, and moderating sessions, showcasing the community aspect of Power BI.

Highlights

June edition of the Power BI monthly update presented by Jason Himmelstein.

Introduction of Scatter plots support within visual calcs.

New highlight feature in the visual matrix for easier editing of visual calcs.

Introduction of a new visual calc exclusive function called 'lookup'.

General availability of the new Power BI Home and Power BI Desktop.

Enhanced functionalities for easier report creation with data sources accessible from the home screen.

Ability to download large semantic models to Power BI Desktop as a PBIX file.

Introduction of new info functions in June 2024, all as DAX function versions of existing analysis services DMVs.

Info functions can now take optional input parameters called restrictions.

Added ability to use DAX Query View while live connected to a published semantic model.

Power BI mobile app update with 'Show Visuals as Table' feature for better accessibility.

Announcement of Power BI enhanced report format PBIR for Power BI Project Files, PBIP.

Demo by Rui Romano on the benefits of Power BI Developer Mode and PBIR.

New visuals in AppSource including Word Cloud, Drill Down Timeline PRO, Attribute Control Chart, and Download Button.

Ability to open and publish paginated reports in folders and subfolders from Power BI Report Builder.

Spotlight on community member Rubayat Yasmin for her contributions and moderation in the Power BI community.

Encouragement for community interaction and feedback on the Power BI Community forums.

Transcripts

play00:03

Hello, Power BI Community.

play00:04

This is the June edition of the Power BI monthly update.

play00:08

I'm Jason Himmelstein, principal PM manager

play00:10

for content strategy and Microsoft Fabric.

play00:12

For more information on the topics in this video,

play00:15

check out the update blog.

play00:16

The link is in the video description below.

play00:19

Let's get started.

play00:21

Power BI reporting.

play00:22

Visual calcs update and preview.

play00:25

You've asked and we have delivered.

play00:27

Scatter plots are now supported within visual calcs.

play00:30

This means you can now add a visual calc to a scatter plot.

play00:34

Please note that the play axis is not yet supported.

play00:37

We've added a highlight to the visual matrix

play00:40

to indicate which visual calc you are editing.

play00:42

We plan to rely on the visual matrix to make working

play00:45

with visual calcs even easier in the future.

play00:48

This highlight is just the first step in our plans.

play00:51

To stop it off for this month

play00:53

in the Power BI reporting section,

play00:55

we're adding a new visual calc exclusive

play00:57

function called lookup.

play00:59

Lookup makes it easy to find values in the visual matrix

play01:02

by specifying which value you want to use

play01:05

as a filter on any axis of the visual matrix.

play01:09

Anything that is not explicitly specified is inferred

play01:13

for context.

play01:14

For example, let's say you have a visual matrix

play01:17

that shows sales per color.

play01:19

The new Power BI Home

play01:20

and Power BI Desktop is now generally available.

play01:23

Introduced last February,

play01:25

this update brings new functionalities that makes it easier

play01:28

for users to create reports.

play01:30

With data sources directly accessible from the home screen,

play01:33

enhanced digital discoverability features

play01:36

like the recommendation sections

play01:37

and the quick access list,

play01:39

getting started is simpler than ever.

play01:42

Power BI modeling.

play01:43

We're thrilled to announce

play01:44

that you can finally download your large semantic models

play01:47

to Power BI Desktop as a PBIX file.

play01:50

This unblocks the end-to-end authoring experience

play01:52

in Power BI Desktop for large semantic models.

play01:55

Dive into our documentation

play01:57

and discover more about this highly anticipated feature,

play01:59

including its capabilities and limitations.

play02:02

New info functions are now available in June of 2024.

play02:06

All info functions are DAX function versions

play02:09

of the existing analysis services Dynamic Management Views

play02:12

or DMVs.

play02:14

All info functions can now take optional

play02:16

input parameters, as DMVs,

play02:19

these optional input parameters are called restrictions.

play02:22

For all info functions, this includes their columns,

play02:25

but some have additional restrictions.

play02:27

Info dot calc dependencies can specify query as one

play02:32

of its restrictions or optional input parameters allowing

play02:35

you to analyze the items in the semantic model needed

play02:37

for that DAX query.

play02:39

This is very helpful when analyzing

play02:41

what is being used by the Semantic model

play02:43

in a DAX query for a visual in the report.

play02:46

We've heard your request and added the ability

play02:49

to use DAX Query View while live connected

play02:51

to a published semantic model.

play02:53

With this release, you can write DAX queries

play02:56

with DAX Query View when live connected

play02:58

to a published semantic model in Power BI Desktop.

play03:01

This includes live connecting

play03:02

to the amazing direct Lake Semantic models created

play03:05

in Microsoft Fabric.

play03:06

Live connect to your published data lake import direct query

play03:09

or composite semantic model in Desktop

play03:12

and use DAX Query view to quickly view data without having

play03:16

to create visuals.

play03:17

Use quick queries to have a DAX query generated

play03:20

for you from any table, column, or measure,

play03:24

and Copilot can help you write your DAX queries as well.

play03:27

Power BI mobile, we strive to make the Power BI mobile app

play03:31

as accessible as possible for everyone.

play03:33

That's why in this month's update,

play03:35

we've added Show Visuals as Table

play03:37

as a view mode to all reports.

play03:40

Use this feature to instantly view all the visuals,

play03:43

excluding slicers, cards,

play03:45

and non-data driven visuals in your report as table visuals.

play03:49

This feature enhances the consumption experience for users

play03:52

who rely on screen readers by allowing them

play03:55

to read the underlying data presented in each visual.

play03:58

It's also beneficial for users who prefer

play04:00

to consume their data in tabular form,

play04:03

which is more like the consumption experience in Excel.

play04:06

Power BI developers, we're very excited

play04:09

to announce the Power BI enhanced report format PBIR

play04:13

for Power BI Project Files, PBIP.

play04:16

This marks a significant milestone

play04:18

in achieving the primary goal

play04:20

of Power BI Desktop Developer Mode, which is

play04:23

to provide source control friendly file formats

play04:26

that unblocks co-development

play04:28

and enhances development efficiency.

play04:32

Power BI Projects, PBIP, now support saving the report

play04:36

and semantic model into a folder using source control

play04:39

friendly formats and PBIR for the file format

play04:43

for report and TMDL, T-M-D-L for the semantic model.

play04:49

Next up, let's check out a demo

play04:50

by Rui Romano on Power BI enhanced report format.

play04:54

- [Rui] Power BI Developer Mode allows you

play04:56

to save your Power BI developments into a folder

play04:59

with metadata text files.

play05:01

One of its promises

play05:03

and pillars, it's to deliver a good source control

play05:06

and co-development experience.

play05:08

To achieve that goal, it's very important

play05:10

to have source control friendly file formats

play05:13

that not only will let you easily track

play05:15

and understand all your changes,

play05:18

but also minimize the occurrence

play05:20

of complex merge diffs while working with others.

play05:24

Back in February, we made a big step in that direction

play05:27

by bringing the table model definition language, TMDL,

play05:31

into Power BI Desktop, saving your semantic model metadata

play05:35

as a folder with a TMDL document

play05:36

for each table, perspective, culture, and more,

play05:40

not only was a big improvement for source control,

play05:42

but also for professional semantic model development

play05:46

using the TMDL language with Visual Studio Code.

play05:49

And this month I'm very excited

play05:51

to announce the Power BI enhanced report format,

play05:55

also known as PBIR,

play05:57

which is a very important milestone for the Power BI team.

play06:00

Because it's the first time ever we are making public

play06:04

with augmentation our report format.

play06:07

Not only it'll provide a great source control

play06:09

and co-development experience

play06:11

because each visual page bookmark

play06:14

will have its own properly formatted adjacent file

play06:18

with adjacent schema that will also allow you

play06:20

to understand what each property means,

play06:23

unblocking a ton new set of opportunities

play06:26

to enhance your report development efficiency,

play06:30

like applying batch edits

play06:32

or easily reuse report objects like visuals

play06:35

and bookmarks between reports.

play06:39

Let's go for a demo.

play06:41

So PBIR is in public review

play06:43

and if you enable the preview feature.

play06:46

Now, when saving as a Power BI project instead

play06:49

of a single report or JSON file,

play06:51

you will have a definition folder using the PBIR format.

play06:58

You can easily navigate to

play06:59

that folder using the title flyout.

play07:04

Let's open the definition folder with Visual Studio Code

play07:07

and notice that now the JSON is properly formatted

play07:11

and the report definition is split into multiple files

play07:15

where each visual has its own individual file,

play07:18

which is very convenient for version control

play07:21

but also co-development.

play07:24

And on each file you will encounter adjacent schema.

play07:28

Not only will that conveniently describe

play07:30

each property meaning with a simple mouse over,

play07:34

but it'll also provide syntax validation if you hand alter

play07:38

the file and you will also get IntelliSense if you want

play07:41

to create a new property.

play07:47

With PBIR, it's now better than ever

play07:50

to granularly track all your report changes.

play07:54

Let's make a few changes in our report

play07:56

and look at the diffs using VSCode and git.

play08:06

Let's save the report,

play08:09

navigate to the PBIP folder,

play08:13

and open the folder in VSCode to look at the changes.

play08:16

Clicking on the source control tab,

play08:19

we can now see two diffs on two visuals

play08:22

and understand what have changed.

play08:24

One visual changed its type

play08:27

and another visual changed its background color.

play08:32

A big goal of PBIR is to improve efficiency and reusability,

play08:36

and an example of that is the support of simple copy

play08:40

and paste of files between reports.

play08:42

For example, you can now easily reuse pages

play08:46

and bookmarks from other reports,

play08:48

something you cannot do using DY.

play08:51

This report has a slicer configuration

play08:53

I want to reuse in my reports.

play08:55

If I save it as a PBIP using PBIR,

play08:58

I can navigate to its PBIR folder definition

play09:03

and copy the bookmark files from the definition folder

play09:07

of this report to the definition folder

play09:10

of the report I'm developing.

play09:19

And repeat the process for the page that has the slicer bay.

play09:29

Because I'm changing files externally,

play09:32

I must restart Power BI Desktop

play09:34

and reopen the PBIP for those changes

play09:37

to be reflected in my report

play09:41

and I can confirm that the new page is there

play09:45

with the slicer panel

play09:46

and the bookmark configuration working fine.

play09:50

And of course because the sematic model is different,

play09:53

the visuals of the page are going to be in error,

play09:56

but I can easily fix that

play09:58

by changing the configured field on each visual

play10:01

and in this case, on each slicer.

play10:05

And this is it, the main takeaways are that now

play10:08

with the PBIR and developer mode, we finally have a public

play10:13

and documented report format, a good source control

play10:16

and co-development experience

play10:18

and also new ways to improve our efficiency working

play10:22

with Power BI Reports.

play10:24

- [Jason] Power BI visualizations,

play10:26

we have new visuals in AppSource this month.

play10:29

Check out the monthly blog update

play10:30

for a more in-depth Look at these visuals.

play10:34

Word Cloud by Powerviz, Drill Down Timeline PRO

play10:37

by ZoomCharts, Attribute Control Chart by Nova Silva,

play10:41

Download Button by JTA.

play10:43

Power BI paginated reports.

play10:46

You can now open reports that are in folders

play10:48

and sub folders from Power BI Report Builder.

play10:51

These reports may reside in folders

play10:53

and sub folders in workspaces that the user has access to.

play10:57

You can also publish paginated reports to folders

play10:59

and sub folders that you have access to in the Power BI

play11:03

and Fabric Service.

play11:05

Power BI Spotlight Member.

play11:07

That's it for the updates.

play11:08

Each month we highlight a community member

play11:10

that's making a positive impact in our community.

play11:13

Meet my fellow Texas resident, Rubayat Yasmin,

play11:16

who is a super user in our community.

play11:19

Rubayat has been a Power BI community member

play11:21

since May of 2023.

play11:24

In that time, she has authored over 150 solutions

play11:27

and has over 700 replies.

play11:30

Rubayat is a valued moderator

play11:32

for Microsoft Learn Together sessions and has gone above

play11:36

and beyond in the community to help us.

play11:38

One thing about Rubayat, she loves using Power Automate

play11:42

and logic apps to let those robots do the heavy lifting

play11:45

while she enjoys a nap.

play11:47

If that's not the definition of working smarter not harder,

play11:50

I don't know what is.

play11:52

Thank you for being a part of our community Rubayat.

play11:55

Well, that's all for this month.

play11:56

Please visit our Power BI Community forums

play11:59

at aka.ms/pbicommunity.

play12:03

It's the best place for you to connect with others

play12:05

to get answers to your questions.

play12:07

And please tell us how we can do better, we are listening.

play12:11

Like, comment, subscribe, and thanks for watching.

Rate This

5.0 / 5 (0 votes)

Étiquettes Connexes
Power BIMonthly UpdateVisual CalcsScatter PlotsDAX FunctionsSemantic ModelsAccessibilityMobile AppDeveloper ModeCommunity Spotlight
Besoin d'un résumé en anglais ?