eTraX™ – Design, Planning & Operation of Rail Traction Systems
Summary
TLDRThe webinar introduces ETAP ETRAX, a comprehensive software solution for designing, planning, and operating rail traction power systems. It addresses industry challenges with outdated technology and presents ETRAX's capabilities, including an integrated AC and DC system, digital twin for design and operation, and energy efficiency initiatives. The software facilitates traction power analysis, infrastructure evaluation, and safety assessments. It also supports the digital transformation journey with real-time data integration, asset management, and operator training simulation, making it a global standard for traction power systems.
Takeaways
- 🚄 Etap Etrax is an integrated solution for designing, planning, and operating rail traction power systems, addressing the needs of railway operators, owners, and engineering consultants.
- 🔍 It offers a digital twin model that allows for the use of the same model created during the design and planning phase within operation stations for traction SCADA and power management.
- 🛠️ Etap Etrax tackles industry challenges such as outdated technology, cumbersome interfaces, and the need for multiple products to achieve different objectives in traction power projects.
- 📈 The software performs traction power analysis, helping to understand substation capacity, implement energy efficiency initiatives, and enhance train timetables to reduce energy consumption and power losses.
- 🔧 It integrates traction power analysis with fault analysis, protection and coordination studies, and arc flash optimization to ensure safety and system reliability.
- 📊 Etap Etrax provides a unified time series AC and DC traction power simulation on a synchronized geospatial view and one-line diagram, enhancing the accuracy and efficiency of train performance calculations.
- 🌐 The software supports importing data from various formats like OpenStreetMap and Excel, streamlining the process of creating a traction power system model.
- 🛤️ Etap Etrax allows for the integration of real-time data with state estimation to improve the accuracy of non-telemetered locations and reduce the need for physical meters.
- 🔗 It offers seamless integration with IEDs, RTUs, SCADA servers, and other devices using industry standard protocols, ensuring a cohesive and modern operational interface.
- 🛡️ Etap Etrax includes features for asset management, operator training simulation, and quality assurance, contributing to the overall digital transformation and optimization of traction power networks.
- 🌟 The solution is verified and validated against field measurements and industry standards, ensuring reliability and accuracy in projects involving AC railways, DC metros, high-speed rail, and more.
Q & A
What is the primary purpose of Etap Etrax?
-Etap Etrax is an integrated solution designed for planning, designing, and operating rail traction power systems. It is utilized by railway operators, owners, and engineering consultants to streamline the traction power design and management process.
What challenges does Etap Etrax aim to address in rail traction power projects?
-Etap Etrax addresses challenges such as outdated technology, cumbersome processes due to archaic graphical user interfaces, the need for multiple products to achieve multiple objectives, difficulties in interfacing with third-party applications, and the manual sharing of engineering information with operations teams.
How does Etap Etrax integrate AC and DC systems?
-Etap Etrax integrates AC and DC systems through the use of a digital twin, allowing traction power groups to use the same model created during the design and planning phase within operation stations for traction SCADA and power management.
What are the benefits of using Etap Etrax for traction power analysis?
-Etap Etrax enables a better understanding of existing and planned substation capacity, implementation of energy efficiency initiatives, enhanced train timetables, and reduction of energy consumption and power losses, which are constant priorities for traction power operators and engineers.
How does Etap Etrax handle the increasing demand for rail systems?
-As demand increases, Etap Etrax allows for the analysis of existing infrastructure to handle additional trains, evaluation and optimization of the system, and improvement of the overall design, while also considering safety and protection aspects.
What is the significance of the digital twin in Etap Etrax?
-The digital twin in Etap Etrax is a single source of truth that contains information regarding the geographical landscape, rolling stock routes, train timetables, and other essential data. It is used to analyze and improve train performance and manage the system efficiently.
How does Etap Etrax facilitate the process of creating a traction power system model?
-Etap Etrax allows users to import data from different file formats, including OpenStreetMap and Excel. The software automatically creates the traction power system based on the imported data, generating a synchronized GIS and one-line diagram.
What capabilities does Etap Etrax provide for analyzing train performance?
-Etap Etrax offers capabilities such as unified time series AC and DC traction power simulation, equipment alignment tools, and the ability to add equipment and update information in the model, which can be used to analyze train performance in various conditions and configurations.
How does Etap Etrax support the integration of renewable energy in traction power systems?
-Etap Etrax supports the integration of renewable energy by incorporating technologies like battery energy storage, flywheel storage, and regenerative braking. It allows users to analyze and optimize the use of these technologies within the traction power system.
What are the advantages of using Etap Etrax for digital transformation in traction power systems?
-Etap Etrax supports digital transformation by providing a digital twin foundation for real-time data analysis, predictive analytics, and validation against as-is environments. It also facilitates root cause analysis, switch plan evaluation, and improved management of data in digital substations.
Outlines

Cette section est réservée aux utilisateurs payants. Améliorez votre compte pour accéder à cette section.
Améliorer maintenantMindmap

Cette section est réservée aux utilisateurs payants. Améliorez votre compte pour accéder à cette section.
Améliorer maintenantKeywords

Cette section est réservée aux utilisateurs payants. Améliorez votre compte pour accéder à cette section.
Améliorer maintenantHighlights

Cette section est réservée aux utilisateurs payants. Améliorez votre compte pour accéder à cette section.
Améliorer maintenantTranscripts

Cette section est réservée aux utilisateurs payants. Améliorez votre compte pour accéder à cette section.
Améliorer maintenantVoir Plus de Vidéos Connexes

Computer Concepts - Module 4: Operating Systems and File Management Part 1A (4K)

Peterson’s Solution

Informática - Aula 4 - Sistemas operacionais
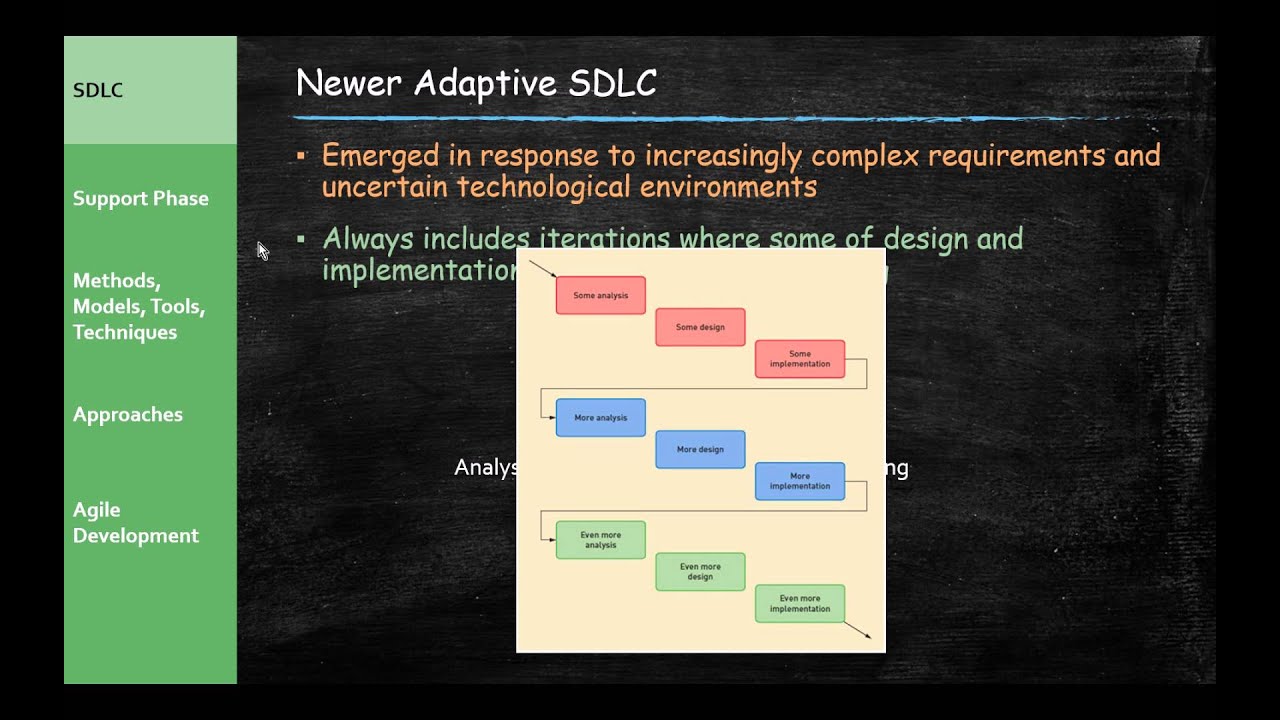
Systems Analysis and Design - Software Development Life Cycle (Part 11)
Mengenal Sistem Operasi Komputer 1
Software and It's Types | Class - 5 Computer | CBSE/ CAIE Computer | Types of Software
5.0 / 5 (0 votes)
