ANALISIS MODEL DUPONT
Summary
TLDRThis video explains the DuPont financial analysis model, breaking down return on assets (ROA) and return on equity (ROE) into key components: profit margin, asset turnover, and financial leverage. It emphasizes how these ratios interact to assess a company's profitability and operational efficiency. The presenter discusses the importance of understanding how asset management impacts net income and highlights the role of competitive pressures in achieving desired financial metrics. Additionally, the video provides practical calculations to demonstrate how to derive these ratios and compares financial performance over time or against similar companies.
Takeaways
- 📊 The DuPont analysis is a financial tool that breaks down Return on Equity (ROE) and Return on Assets (ROA) into key components.
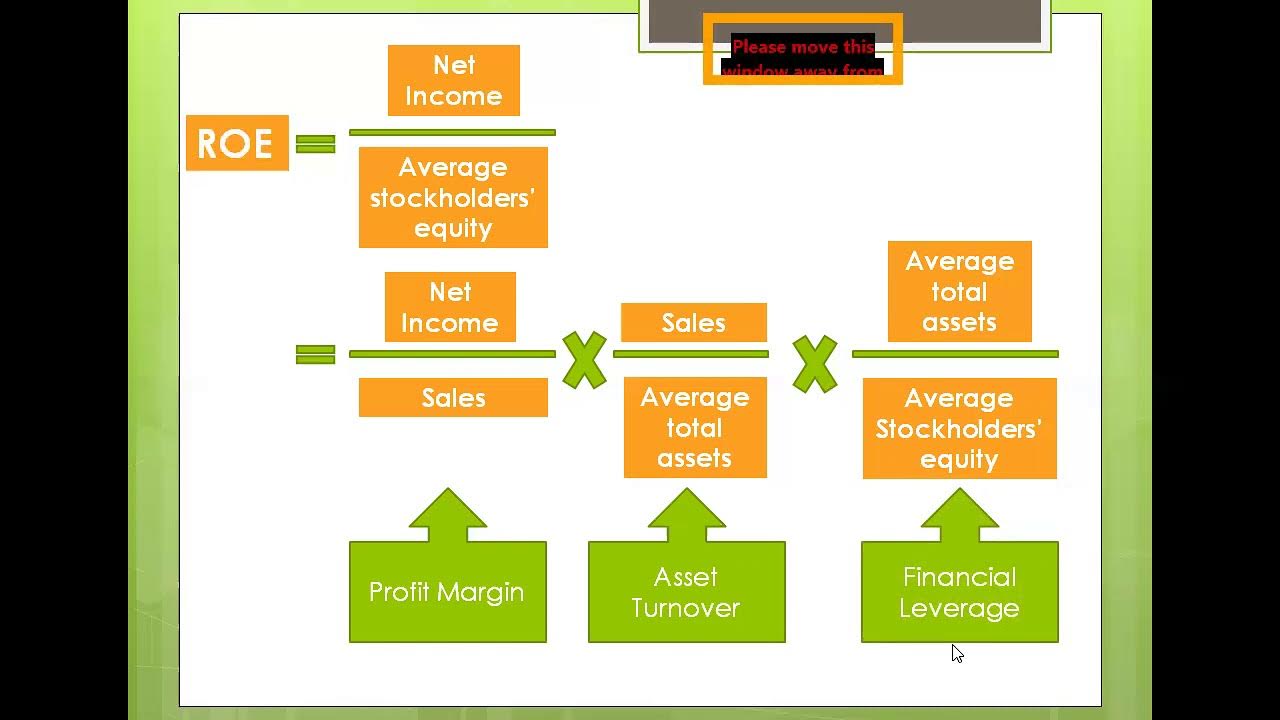
- 💰 It emphasizes the relationship between profit margin, asset turnover, and financial leverage in assessing a company's performance.
- 🔍 Profit margin is calculated as net income divided by total sales, indicating the efficiency of a company in generating profit from sales.
- 📈 Asset turnover is determined by dividing total sales by total assets, measuring how effectively a company uses its assets to generate revenue.
- ⚖️ Leverage is assessed through the equity multiplier, which is the ratio of total assets to equity, highlighting the extent of debt used to finance assets.
- 🔗 ROE can be calculated using the formula: ROE = Net Profit Margin × Asset Turnover × Equity Multiplier.
- 📉 Companies striving for high ROE should consider increasing profit margins, enhancing asset turnover, or increasing financial leverage.
- 🔄 The transcript highlights that management needs to balance profit margin and asset turnover against competitive pressures.
- 📊 An example from a 2016 financial report illustrates the calculation of ROE and its components using actual data.
- 🏢 Comparative analysis is crucial for assessing performance against previous periods or similar companies in the industry.
Q & A
What is the focus of the video script?
-The video script focuses on the analysis of financial statements using the DuPont model, which breaks down return on equity (ROE) and return on assets (ROA) into key components.
How does the DuPont analysis relate profit margin and asset turnover?
-DuPont analysis connects profit margin and asset turnover to determine ROE, illustrating how these ratios interact to affect a company's financial performance.
What is the formula for calculating return on assets (ROA)?
-The formula for calculating ROA is net income divided by total assets, demonstrating how effectively a company utilizes its assets to generate profit.
Why is return on equity (ROE) significant in financial analysis?
-ROE is significant because it measures a company's ability to generate profit from its shareholders' equity, indicating the efficiency of the company in creating returns for its investors.
What components are involved in calculating ROE using the DuPont model?
-The DuPont model calculates ROE by multiplying net profit margin, total asset turnover, and equity multiplier, providing a comprehensive view of the company's financial performance.
What does a high asset turnover ratio indicate?
-A high asset turnover ratio indicates that a company is efficiently utilizing its assets to generate sales, which can lead to higher profitability.
How can a company improve its ROA according to the script?
-A company can improve its ROA by increasing either the profit margin or the asset turnover, or both, while maintaining a manageable level of debt.
What role does financial leverage play in increasing ROE?
-Financial leverage plays a crucial role in increasing ROE, as it allows a company to use borrowed funds to enhance its equity returns, though it also increases financial risk.
How can investors utilize the DuPont analysis?
-Investors can use the DuPont analysis to evaluate which components of financial performance are contributing to changes in ROE, allowing them to make informed investment decisions.
What is the significance of comparing financial results across periods or companies?
-Comparing financial results across periods or with similar companies helps assess performance consistency and competitiveness, providing insights into a company's relative financial health.
Outlines

Cette section est réservée aux utilisateurs payants. Améliorez votre compte pour accéder à cette section.
Améliorer maintenantMindmap

Cette section est réservée aux utilisateurs payants. Améliorez votre compte pour accéder à cette section.
Améliorer maintenantKeywords

Cette section est réservée aux utilisateurs payants. Améliorez votre compte pour accéder à cette section.
Améliorer maintenantHighlights

Cette section est réservée aux utilisateurs payants. Améliorez votre compte pour accéder à cette section.
Améliorer maintenantTranscripts

Cette section est réservée aux utilisateurs payants. Améliorez votre compte pour accéder à cette section.
Améliorer maintenant5.0 / 5 (0 votes)


