Indifference Curves
Summary
TLDRThis video explores the concept of indifference curves in economics, illustrating how consumers make choices between goods like pizza and coffee based on their preferences and income constraints. It explains how combinations of goods can be ranked and plotted to represent varying levels of utility. The marginal rate of substitution is introduced, showing how consumers are willing to trade one good for another while maintaining satisfaction. The video also covers different shapes of indifference curves, including those for substitutes and perfect complements, and emphasizes that these curves cannot intersect, reflecting consistent consumer preferences.
Takeaways
- 😀 Choices in consumption are influenced by income and prices, but preferences also play a significant role.
- 🍕 A graph can illustrate the trade-offs between two goods, like pizzas and coffee, helping to visualize preferences.
- 📈 More of a good generally leads to greater utility, meaning combinations with higher quantities are preferred.
- ⚖️ Indifference curves represent combinations of goods that provide the same level of satisfaction or utility.
- 🔄 The marginal rate of substitution indicates how much of one good a consumer is willing to give up to obtain more of another good.
- 📉 As a consumer has more of one good, their willingness to give up the other good typically decreases.
- 🔺 Indifference curves usually bow inward, reflecting the changing marginal rate of substitution as consumption levels vary.
- 🍊 Perfect substitutes have constant marginal rates of substitution, leading to straight-line indifference curves.
- 🌭 Perfect complements create right-angle indifference curves, as they require fixed proportions of each good.
- 📏 Indifference curves cannot intersect, as this would imply conflicting levels of utility for the same combination of goods.
Q & A
What constraints do consumers face when making purchasing decisions?
-Consumers are constrained by their own income and the prices of goods.
How does the concept of utility relate to consumer preferences?
-Utility refers to the satisfaction or pleasure derived from consuming goods, influencing consumer preferences for more of what they enjoy.
What is an indifference curve?
-An indifference curve is a graphical representation of different combinations of goods that provide the same level of satisfaction or utility to a consumer.
Why do indifference curves typically slope downward?
-Indifference curves slope downward because to maintain constant utility while increasing the quantity of one good, a consumer must decrease the quantity of another good.
What does the marginal rate of substitution measure?
-The marginal rate of substitution measures the rate at which a consumer is willing to give up one good in exchange for an additional unit of another good, while keeping utility constant.
What happens to the marginal rate of substitution as a consumer consumes more of a good?
-As a consumer consumes more of a good, the marginal rate of substitution typically decreases, indicating they are less willing to give up the other good for additional units.
How do perfect substitutes differ from perfect complements in terms of indifference curves?
-Perfect substitutes have straight-line indifference curves with a constant marginal rate of substitution, while perfect complements have right-angle indifference curves, requiring one good for every unit of the other.
What common properties do indifference curves share?
-Indifference curves slope downward, further curves from the origin indicate higher utility, and they cannot intersect each other.
What is the significance of the area inside and outside the indifference curve?
-Points within the indifference curve represent combinations of goods that yield less utility, while points further from the origin indicate combinations yielding more utility.
How do consumer choices change when considering income and prices?
-Consumer choices become constrained by their budget and the prices of goods, requiring them to make trade-offs between different goods to maximize their utility.
Outlines

Cette section est réservée aux utilisateurs payants. Améliorez votre compte pour accéder à cette section.
Améliorer maintenantMindmap

Cette section est réservée aux utilisateurs payants. Améliorez votre compte pour accéder à cette section.
Améliorer maintenantKeywords

Cette section est réservée aux utilisateurs payants. Améliorez votre compte pour accéder à cette section.
Améliorer maintenantHighlights

Cette section est réservée aux utilisateurs payants. Améliorez votre compte pour accéder à cette section.
Améliorer maintenantTranscripts

Cette section est réservée aux utilisateurs payants. Améliorez votre compte pour accéder à cette section.
Améliorer maintenant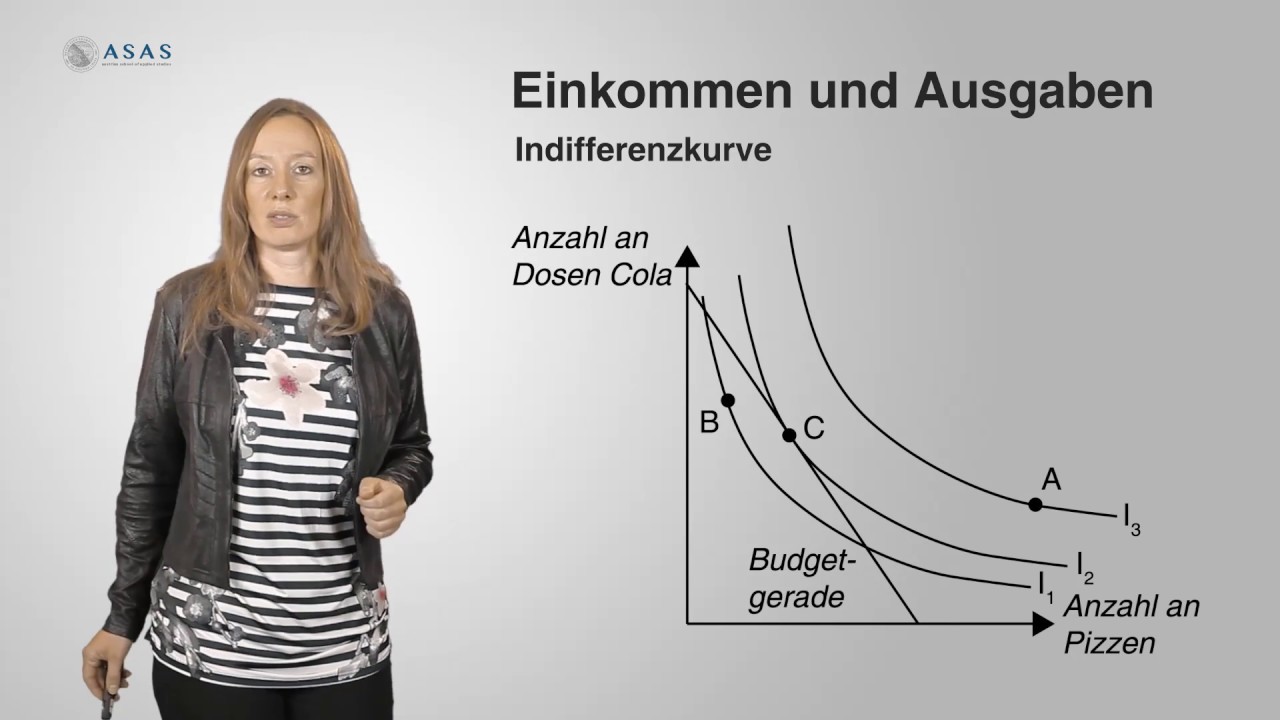


5.0 / 5 (0 votes)
