NVDA Stock - NVIDIA Bulls Are Coming Back!
Summary
TLDRIn this Nvidia daily update, the video covers potential market volatility this week due to triple witching and possible rate cuts. Nvidia is forming a potential bull flag, with key levels at 174 (support), 181 (Fibonacci resistance), and 184 (all-time highs). A breakout above 181 could signal strong bullish momentum, while failure may lead to a lower high or retracement. Broader market trends show slight overextension but overall strength, with notable setups in AMD, Amazon, and Microsoft. The video also highlights options flow, indicating bulls are generally in control, while providing a concise technical roadmap for tracking Nvidia and related stocks.
Takeaways
- 😀 Nvidia stock is experiencing some volatility, with a potential bull flag setup forming, but the overall trend remains uncertain.
- 📉 The stock is currently down 0.04%, but there's potential for upward movement if certain levels are broken, especially above $181 and the all-time high at $184.
- ⚖️ The market this week is expected to be volatile due to potential rate cuts and the triple witching event, so caution is advised.
- 📊 Technical analysis suggests that a breakout above $181 would be a bullish sign, while a drop below $174 would signal weakness.
- 💡 If Nvidia holds above key levels, it could continue to build bullish momentum, but if it breaks certain supports, further downside is possible.
- 🧩 The situation is mixed, with both bullish and bearish scenarios possible depending on how key price levels hold up.
- 💻 The speaker is also bullish on AMD, suggesting that Nvidia might follow a similar trend if AMD performs well.
- 📈 The broader market, particularly the QQQ index, is strong, but it's becoming extended and might experience a pullback before continuing higher.
- 🛠️ The speaker advises watching the 9 EMA and 21 EMA as key indicators for the broader market's direction.
- 🚀 Amazon is highlighted as one of the best setups right now, with a strong rising triangle pattern forming, which the speaker is already invested in.
- 🐻 Netflix is flagged as potentially one of the worst setups, with its price action appearing weak despite some potential for a bullish reversal.
Q & A
What is the primary focus of the video transcript?
-The primary focus is providing a daily market update on Nvidia, including technical analysis, key stock levels, potential bullish and bearish scenarios, and broader market context.
What key events are mentioned that could cause market volatility this week?
-The key events are potential interest rate cuts and triple witching, both of which could create significant market volatility.
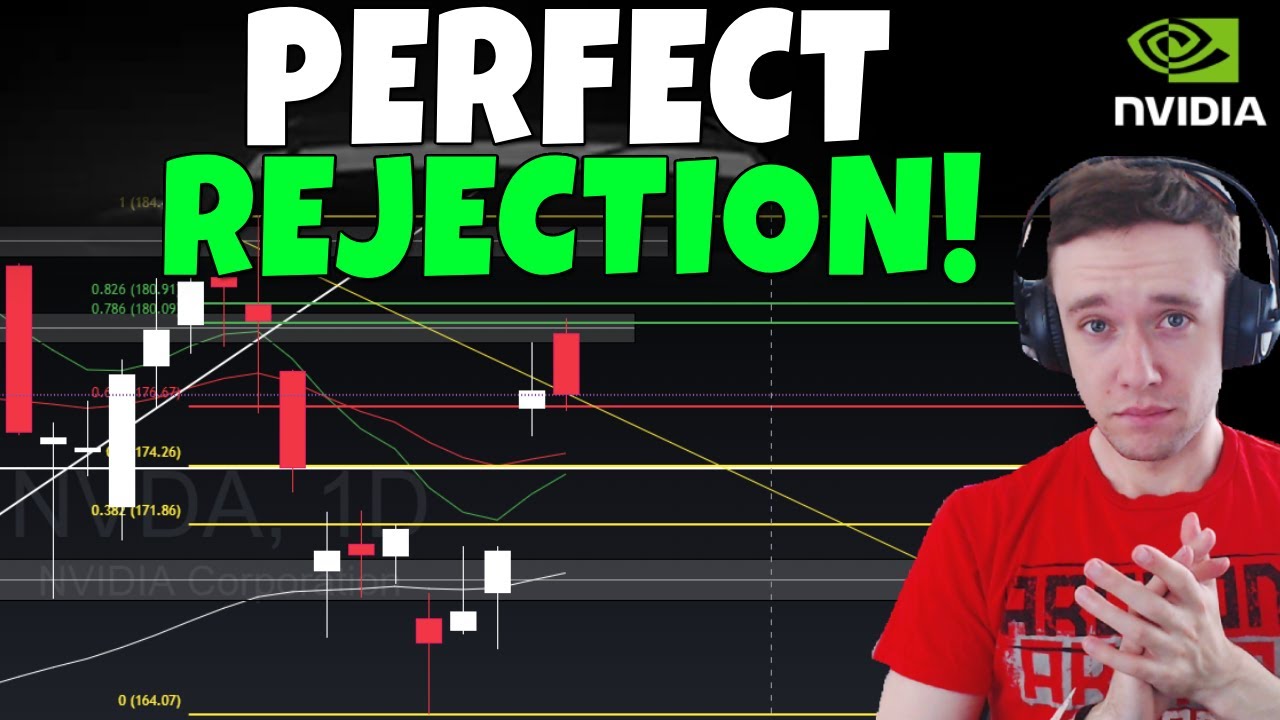
What technical levels are critical for Nvidia according to the analysis?
-Critical levels for Nvidia include support around $174 (daily low and EMAs) and resistance around $181 (green Fibonacci level) with all-time highs near $184.
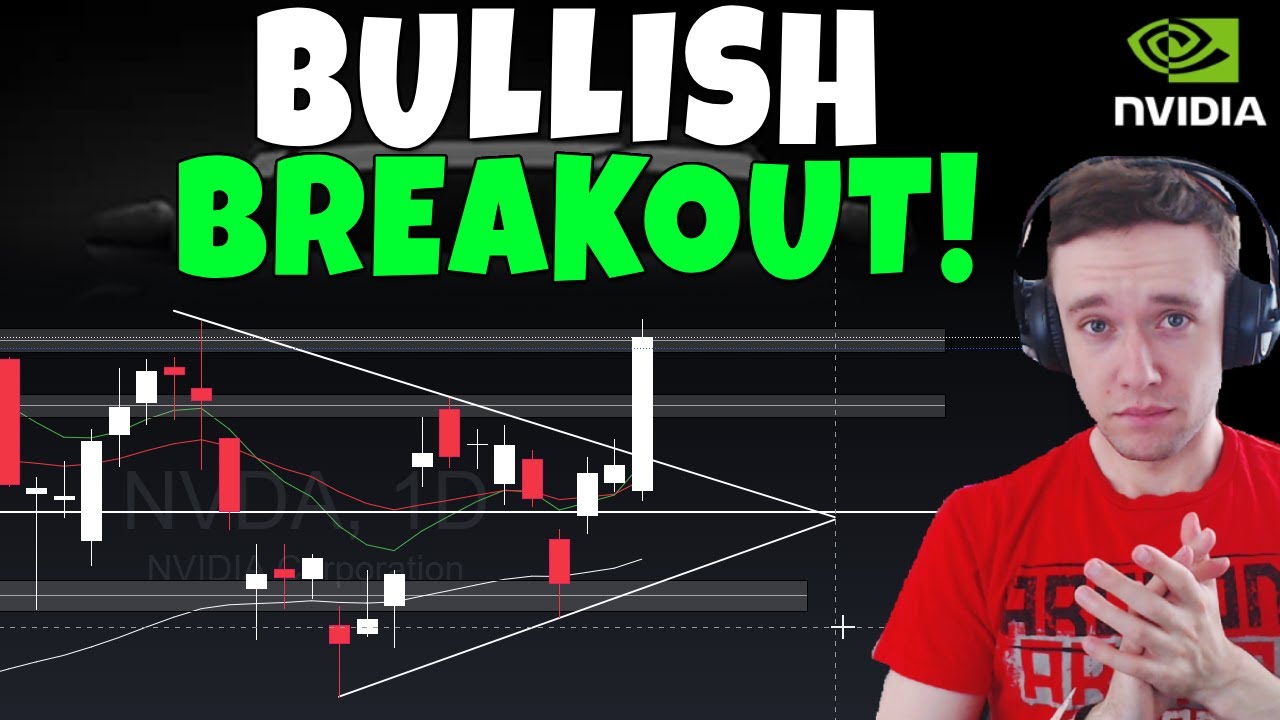
What does a break above $181 for Nvidia indicate?
-A break above $181 would be considered bullish, potentially confirming a bull flag pattern and reigniting upward momentum.
What would it signify if Nvidia falls below the $174 support level?
-Falling below $174 could indicate weakness, potentially leading to further downside toward the weekly target of previous all-time highs around $150.
How does the analyst describe the current market sentiment for Nvidia?
-The sentiment is mixed; while there is bullish potential with a forming bull flag, there is still a real possibility of a lower high if key resistance levels fail.
What is said about AMD and its potential impact on Nvidia?
-The analyst is bullish on AMD, suggesting that if AMD performs well, it may positively influence Nvidia's performance as well.
Which other stocks are highlighted as having strong setups?
-Amazon (rising triangle setup) and Microsoft (breakout) are highlighted as strong setups, while Apple and Google are neutral, Meta is okay, and Netflix is weak.
What broader market indicators are suggested for monitoring short-term trends?
-Key indicators include the 9 and 21 exponential moving averages (EMAs) and previous all-time highs, which help assess potential short-term pullbacks or continuation of bullish trends.
What does the transcript say about options flow and market control?
-Options flow suggests that bulls are generally in control, though bears are active at certain times, indicating ongoing short-term market contention.
What does the analyst recommend watching for to confirm the bull flag on Nvidia?
-The analyst recommends monitoring a break above two-day highs and specifically above the $181 Fibonacci level to confirm the bull flag and reduce the risk of forming a lower high.
How does the analyst view potential short-term market pullbacks?
-The analyst notes that the market is slightly extended from the 9 EMA and could see short-term shakeouts, particularly after the potential rate cut, but as long as key support levels hold, it may just be a retest before continuing higher.
Outlines

Esta sección está disponible solo para usuarios con suscripción. Por favor, mejora tu plan para acceder a esta parte.
Mejorar ahoraMindmap

Esta sección está disponible solo para usuarios con suscripción. Por favor, mejora tu plan para acceder a esta parte.
Mejorar ahoraKeywords

Esta sección está disponible solo para usuarios con suscripción. Por favor, mejora tu plan para acceder a esta parte.
Mejorar ahoraHighlights

Esta sección está disponible solo para usuarios con suscripción. Por favor, mejora tu plan para acceder a esta parte.
Mejorar ahoraTranscripts

Esta sección está disponible solo para usuarios con suscripción. Por favor, mejora tu plan para acceder a esta parte.
Mejorar ahora


5.0 / 5 (0 votes)
