Predict “The NEXT Candle” Using VSA | Price Action & Volume Spread Analysis Trading Course
Summary
TLDRThis video introduces Volume Spread Analysis (VSA), a leading strategy used by banks and professional traders to anticipate market movements. VSA studies price in relation to volume to identify market behavior, focusing on smart money activity. It's applicable across various markets and timeframes, offering a non-subjective approach to understand market psychology. The script covers the basics of VSA, including its components and stages based on Wyckoff's theory, and discusses the application of VSA in detecting signs of market strength and weakness.
Takeaways
- 📈 Volume Spread Analysis (VSA) is a leading trading strategy used by banks and professional traders to understand market psychology and sentiments.
- 🔍 VSA studies price in relation to volume to identify the reasons behind market movements, focusing on the activity of 'smart money' such as big banks and hedge funds.
- 🛡 Volume Spread Analysis eliminates subjectivity from trading as volumes cannot be manipulated like prices can by professional activity.
- 🌐 VSA can be applied to various markets including forex, stocks, indices, commodities, and futures, even utilizing tick volumes in the decentralized forex market.
- 📊 The four stages of VSA based on Wyckoff theory are Accumulation, Mark Up, Distribution, and Mark Down, each representing a phase in the market cycle.
- 💪 Two major applications of VSA are tracking Signs of Strength (SOS) and Signs of Weakness (SOW), which indicate shifts in supply and demand dynamics.
- 📊 SOS occurs when supply is exhausted and demand increases, causing the market to rise, while SOW happens when demand is exhausted and supply increases, leading to a market fall.
- 📌 Types of Signs of Strength include Down Thrust, Selling Climax, and various scenarios where bearish effort does not match the result, indicating an upcoming price rise.
- 📉 Types of SOW include Up Thrust, Buying Climax, and situations where bullish effort does not match the result, signaling a potential price drop.
- 🔑 VSA is a powerful technique for revealing true market sentiment and order flow, offering insights into the underlying reasons for market movements.
- 👍 The video encourages viewers to engage with the content by liking and subscribing to support the channel and receive more advanced strategies in future videos.
Q & A
What is Volume Spread Analysis (VSA) and why is it significant for traders?
-Volume Spread Analysis (VSA) is the study of price in relation to its corresponding volume. It is significant for traders because it identifies the underlying reasons behind market behavior or movement, tracks professional activity, and eliminates subjectivity from trading by focusing on volume, which cannot be manipulated like price.
Who is considered as 'Smart Money' in the context of Volume Spread Analysis?
-'Smart Money' in the context of VSA refers to Big Banks, Hedge Funds, and Large Financial Institutions that have the financial power to influence the market direction.
How does VSA eliminate subjectivity from trading?
-VSA eliminates subjectivity from trading because it relies on the relationship between price and volume. While prices can be manipulated by professional activity, volumes cannot, providing a more objective analysis of market sentiment and psychology.
In which markets can Volume Spread Analysis be applied?
-VSA can be applied in various markets including forex, stocks, indices, commodities, and futures.
What is the difference between Tick Volumes and actual volumes in the context of forex trading?
-In forex, which is a decentralized market, Tick Volumes serve as a proxy to real volumes and correlate with them about 90% of the time, since actual volumes are not readily available.
What are the four stages of VSA based on Wyckoff theory?
-The four stages of VSA based on Wyckoff theory are: 1) Accumulation, where supply and demand are in balance after a mark down move. 2) Mark Up, where demand exceeds supply, causing an upward rally. 3) Distribution, where supply and demand are balanced after an exhausted mark-up move. 4) Mark Down, where supply exceeds demand, leading to a downward drop.
What are the two major applications of VSA?
-The two major applications of VSA are tracking of SOW (Sign of Weakness) and tracking of SOS (Sign of Strength), which help identify when demand or supply is exhausted and anticipate potential market movements.
What is a Down Thrust in VSA and what does it signify?
-A Down Thrust in VSA is a bullish pin bar or doji bar with an ultra-high volume or above average high volume and an extremely low spread. It signifies a divergence between spread and volume, indicating more demand than supply and suggesting a potential price rise in the near future.
What is a Selling Climax and what does it indicate about the market?
-A Selling Climax is a high spread bearish candle with a noticeable downward rejection wick, projected on ultra-high or above average high volume. It indicates that there is more demand than supply, suggesting that the market is likely to rise.
What is the difference between a No Supply Bar and a Pseudo Down Thrust in VSA?
-A No Supply Bar is a low spread bearish candle with a downward wick and volume lower than the previous two candles, indicating a lack of supply and a potential price rise. A Pseudo Down Thrust is a bullish pin bar or doji bar with low spreads and volume lower than the previous two candles, also suggesting a lack of supply and a potential price rise, but it is specifically a continuation signal after bullish momentum or a Sign of Strength.
How can a Failed Effort Selling Climax be identified and what does it imply for the market?
-A Failed Effort Selling Climax is identified by a high spread and volume greater than the previous candle without a downward rejection wick. It shows a disagreement between volume and price compared to previous candles. However, if the next candle is bullish, absorbing the entire bearish effort, it implies a potential market rise.
What is the significance of the Inverse Down Thrust in VSA and how does it differ from a regular Down Thrust?
-An Inverse Down Thrust in VSA is an inverse bullish pin bar or doji bar with low spreads and projected on ultra-high or above average high volume. Unlike a regular Down Thrust, which has a low spread with high volume, the Inverse Down Thrust shows a disagreement between spread and volume, indicating more demand than supply and a potential price rise in the near future.
What are the key takeaways from the script regarding the importance of volume in understanding market movements?
-The key takeaways are that volume is a crucial indicator of market sentiment and order flow, it cannot be manipulated, and it provides objective insights into market psychology. Analyzing volume in conjunction with price movements can help traders anticipate market trends and make informed trading decisions.
Outlines

Esta sección está disponible solo para usuarios con suscripción. Por favor, mejora tu plan para acceder a esta parte.
Mejorar ahoraMindmap

Esta sección está disponible solo para usuarios con suscripción. Por favor, mejora tu plan para acceder a esta parte.
Mejorar ahoraKeywords

Esta sección está disponible solo para usuarios con suscripción. Por favor, mejora tu plan para acceder a esta parte.
Mejorar ahoraHighlights

Esta sección está disponible solo para usuarios con suscripción. Por favor, mejora tu plan para acceder a esta parte.
Mejorar ahoraTranscripts

Esta sección está disponible solo para usuarios con suscripción. Por favor, mejora tu plan para acceder a esta parte.
Mejorar ahoraVer Más Videos Relacionados
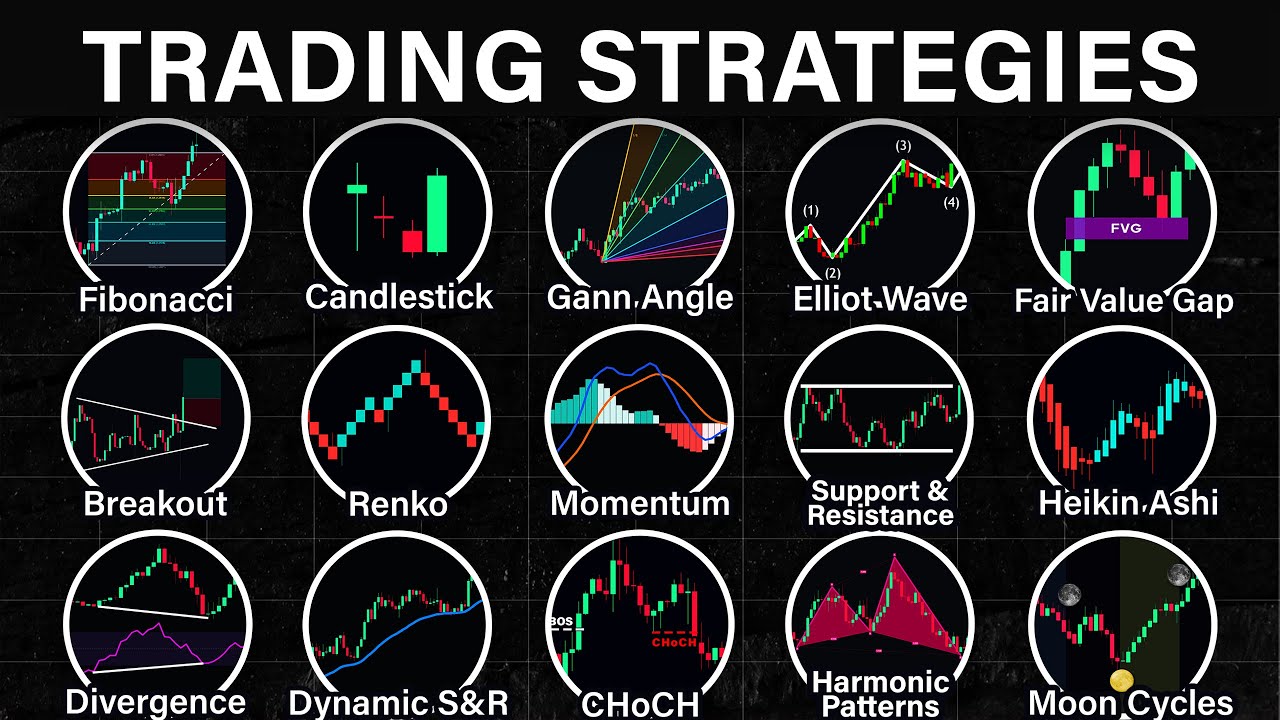
Every Trading Strategy Explained in 12 Minutes

Liquidity Concepts Explained: BEST Strategies Revealed
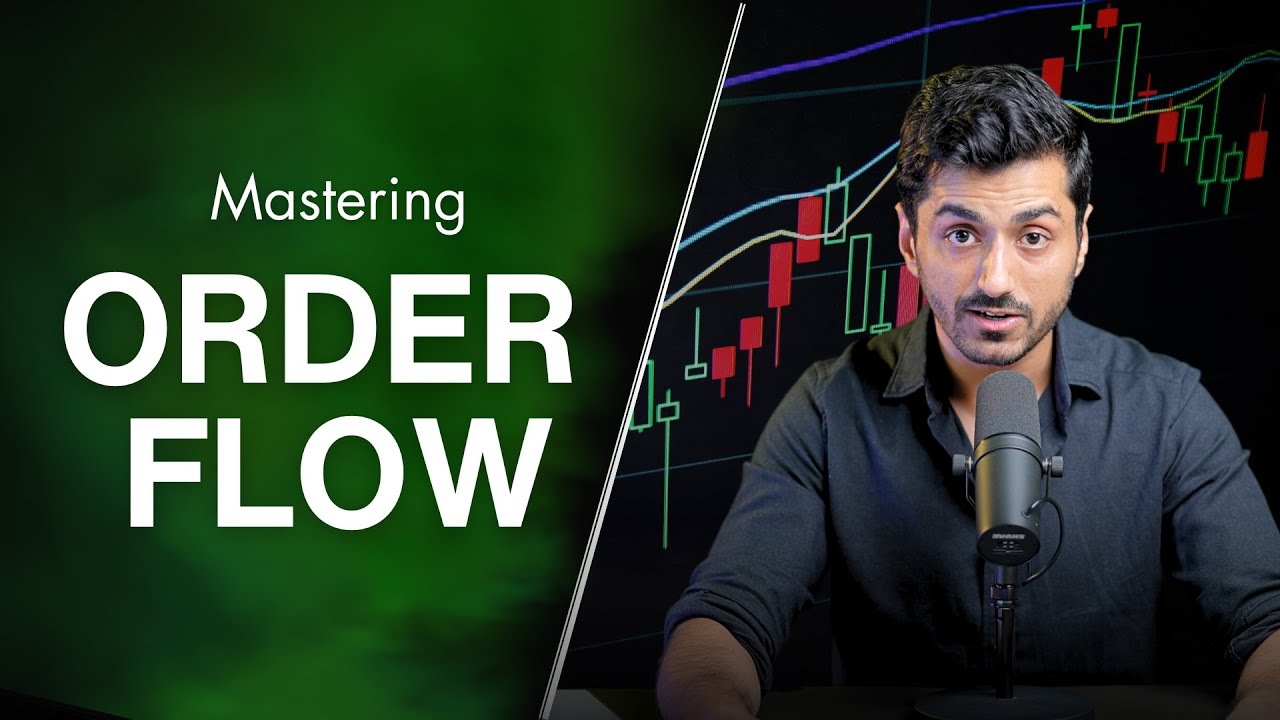
Mastering Order Flow To Make Money Trading (2023)

Best AI TradingView Indicator in 2024 | 100% Winning Strategy 🔥

ICT Mentorship Core Content - Month 04 - ICT Breaker Block

Volume Analysis That Every Trader Must Know 🔥
5.0 / 5 (0 votes)
