Understanding Relations I Señor Pablo TV
Summary
TLDRThis educational video script introduces the concept of relations in mathematics, focusing on the representation of ordered pairs. It outlines four distinct methods to depict relations: table of values, mapping or arrow diagram, graph, and rule. The script explains each method with examples, starting with the table of values, where x and y coordinates are listed, followed by the mapping diagram that uses arrows to show the relationship between domains and ranges. The graph method plots these points in a coordinate system, and the rule method identifies a pattern, such as the sum of coordinates being constant. The script is designed to help viewers understand and visualize mathematical relations effectively.
Takeaways
- 📚 A relation is defined as a set of ordered pairs, with each pair consisting of an x-coordinate (abscissa) and a y-coordinate (ordinate).
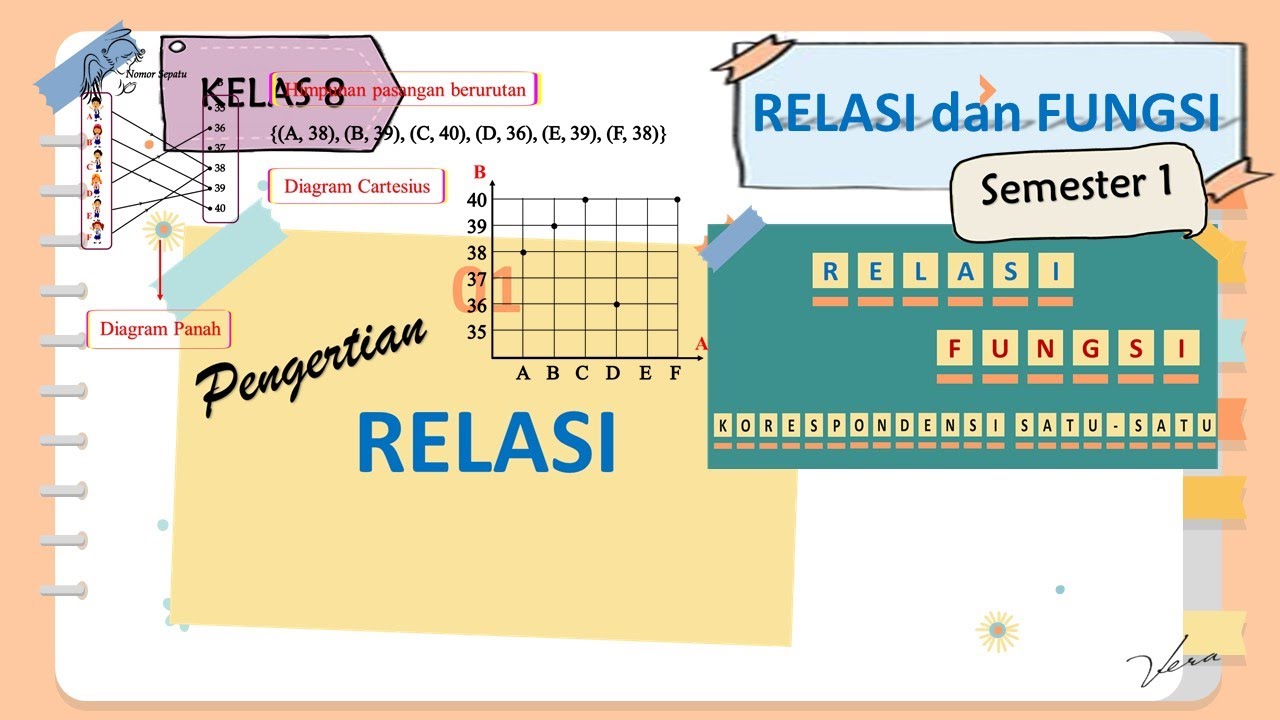
- 📊 There are four primary ways to represent relations: table of values, mapping or arrow diagram, graph, and rule.
- 📈 The table of values is a tabular representation where the x-coordinates (abscissa) are listed horizontally and the y-coordinates (ordinate) are listed vertically.
- 🔍 The mapping or arrow diagram visually shows the relationship between x and y coordinates using arrows to connect corresponding values.
- 📊 The graph representation plots the ordered pairs on a coordinate system, allowing for a visual understanding of the relation as a whole.
- ✏️ The rule representation is a mathematical formula or condition that defines the relationship between the x and y coordinates, such as a sum or product.
- 🔢 For the given example, the rule is that the sum of the x-coordinate and y-coordinate equals six, illustrating a specific type of linear relation.
- 📐 The graph of the relation is a visual tool that can help identify patterns or characteristics of the relation, such as whether it is a linear function.
- 📝 Understanding different representations of relations is crucial for various mathematical applications, including functions and data analysis.
- 🎓 The video serves as an educational resource, teaching viewers how to interpret and work with relations in multiple formats.
Q & A
What is a relation in mathematics?
-A relation in mathematics is a set of ordered pairs, where each pair consists of an x-coordinate (abscissa) and a y-coordinate (ordinate).
How many ways can a relation be represented?
-A relation can be represented in four different ways: as a table of values, a mapping or arrow diagram, a graph, and by a rule.
What is the term for the first number in an ordered pair?
-The first number in an ordered pair is called the abscissa or x-coordinate.
What is the term for the second number in an ordered pair?
-The second number in an ordered pair is called the ordinate or y-coordinate.
How is a table of values created for a relation?
-A table of values is created by listing the x-coordinates (abscissa) in one column and the corresponding y-coordinates (ordinate) in another column.
What is a mapping or arrow diagram?
-A mapping or arrow diagram is a visual representation of a relation where each x-coordinate is connected to its corresponding y-coordinate with an arrow.
What is the term for the left side of a mapping diagram?
-The left side of a mapping diagram is known as the domain, which represents the set of x-coordinates.
What is the term for the right side of a mapping diagram?
-The right side of a mapping diagram is known as the range, which represents the set of y-coordinates.
How are points plotted on a graph to represent a relation?
-Points are plotted on a graph by marking the x-coordinate on the horizontal axis and the corresponding y-coordinate on the vertical axis.
What is a rule in the context of representing a relation?
-A rule is a mathematical statement or condition that defines the relationship between the x-coordinate and y-coordinate in a set of ordered pairs.
Can you provide an example of a rule from the script?
-Yes, an example of a rule from the script is that if you add the x-coordinate (abscissa) and y-coordinate (ordinate), the sum equals six.
Outlines
📊 Introduction to Relations and Representation Methods
This paragraph introduces the concept of a relation in mathematics, which is defined as a set of ordered pairs. It explains that relations can be represented in four different ways: as a table of values, a mapping or arrow diagram, a graph, and by a rule. The paragraph emphasizes the components of an ordered pair, namely the abscissa (x-coordinate) and the ordinate (y-coordinate). It provides an example set of ordered pairs and demonstrates how to create a table of values by listing the x-coordinates (abscissa) and y-coordinates (ordinate) separately. The paragraph also briefly introduces the mapping or arrow diagram, explaining that it involves drawing arrows from the domain (x-values) to the range (y-values) based on the given ordered pairs.
📈 Visualizing Relations Through Graphs and Rules
This paragraph continues the explanation of representing relations by discussing the graph method. It describes how to plot points on a rectangular coordinate system based on the ordered pairs, with positive and negative numbers on both axes. The paragraph provides a step-by-step guide on plotting the points and connecting them to form a graph, which in this case, represents a linear function. It concludes by introducing the concept of representing relations through a rule, which is a mathematical formula that defines the relationship between the x and y coordinates. The example given is a rule where the sum of the x and y coordinates equals six, demonstrating how this rule can be used to determine if a pair belongs to the relation.
Mindmap
Keywords
💡Relations
💡Ordered Pairs
💡Table of Values
💡Mapping or Arrow Diagram
💡Graph
💡Abscissa
💡Ordinate
💡Domain
💡Range
💡Rule
Highlights
A relation is defined as a set of ordered pairs.
Relations can be represented in four different ways: table of values, mapping or arrow diagram, graph, and rule.
An ordered pair consists of an x-coordinate (abscissa) and a y-coordinate (ordinate).
The table of values is created by listing x and y coordinates in a tabular form.
The mapping or arrow diagram visually represents the relation with arrows from the domain to the range.
The domain represents the set of x-coordinates, and the range represents the set of y-coordinates.
The graph method plots the ordered pairs on a rectangular coordinate system to visualize the relation.
Positive and negative numbers are plotted accordingly on the coordinate system.
The rule for the relation can be a mathematical formula that relates the x and y coordinates.
In this example, the rule is that the sum of the x and y coordinates equals six.
The video provides a step-by-step guide on how to plot points using the graph method.
Connecting the plotted points on the graph can represent the relation as a linear function.
The video concludes by summarizing the four ways to represent relations.
The video is educational, providing a clear explanation of mathematical relations.
The use of visual aids such as diagrams and graphs enhances understanding of abstract concepts.
The video is suitable for learners seeking to understand the fundamentals of relations in mathematics.
Transcripts
in this video you will learn what is
relations
relations is a set of ordered pairs
aside from ordered pairs a relation can
be also represented by
four different ways first we have the
table of values
second we have the mapping or
arrow diagram third we can also be
represented by
a graph and four can be represented
by a rule a set of ordered pairs is
composed of
x-coordinate and y-coordinate
the x-coordinate is also known as the
abscissa and the y-coordinate is also
known as the
ordinate let's say we have the following
ordered pairs we have
zero six one five
two four three three
four two five one
six zero we know that the first point
is also called the abscissa or the
x-coordinate
and the second is the
y-coordinate or the ordinate
now let us name it using our first
the table of volumes
table of values
for the table of values we will create
our diagram
and we will name it as x and y
we're talking about the abscissa and the
ordnance
so one two three four five six seven we
have seven sets
one two three four
five six seven one two three four five
six and seven so let us write all the
x coordinate under our
x so our x are
zero one
two three
three four
five and six
and now our ordinate
so we have six
five four
three two
one and zero
this is what we call the table of values
the other way is the mapping or
arrow diagram so
using our ordered pairs let us write it
using the
mapping
or arrow
diagram
so in this case we have
a diagram which is
on the left side we can call it as our
x-coordinate and
our y are the y coordinates
take note our m z side is also known as
our domains
or the value of the x and
y would write here domain
and y coordinates will be our
range now let's write
all our abscissa or our domain
zero one
two three
four five
and six and of course our
range we have six
five four
three two
one and zero
we have arrows so we need to draw an
arrow using our ordered pairs so
our first pair is zero six
so let us have zero
six second
one five one moving five
next two four so two
going to four
three three three going to three
four four going to two
and five going to one
and six zero
so that is our mapping or
arrow diagram
our second way in writing our relations
let us proceed in the third one the
graph the coordinates of the origin is
zero zero that means on the right side
of our
vertical line we have the positive one
two
three four five six
and upward we have also the positive
numbers
one two three four
five six on the lower part
we have negative numbers negative one
negative two
negative three and so on and on
the left side we have the negative
numbers negative one negative two
negative three negative four negative
five
negative six this time we're going to
plot the points in our ordered pairs
so zero six four is zero x is zero
then y positive six so zero
going to six
next one five so one
going up to five
next two four two
four two going to four
next three three three going up three
next four two
next five one
and last six for x and 0 for y
so this is now our plotted
ordered pair so we plot it in our
rectangular coordinate system
then we can connect the dots
or the points this is now our
graph and that is a linear function
so this is on how to plot the different
points using our graph
and that can also be represented
as our relation
now let us proceed to the last one we
have the rule
rule or
rules in this case
take a look at our x-coordinate and
y-coordinate
so our rule is if i am going
to add the abscissa
and the ordinate the sum is six
one plus five is gonna be six
two plus four six three plus three
six four plus two six
five plus one is equal to six and six
plus zero is equal to six
so our rule is that if i am going to add
the
x coordinate plus
y coordinate that is equal to
six so this
is our rule
so those are the four ways to represent
our relations
first the table of volumes
second the mapping or arrow diagram
third is using the graph and fourth
is using rule so thank you for watching
senior public tv
that is the relations
you
Ver Más Videos Relacionados
THE LANGUAGE OF RELATIONS AND FUNCTIONS || MATHEMATICS IN THE MODERN WORLD
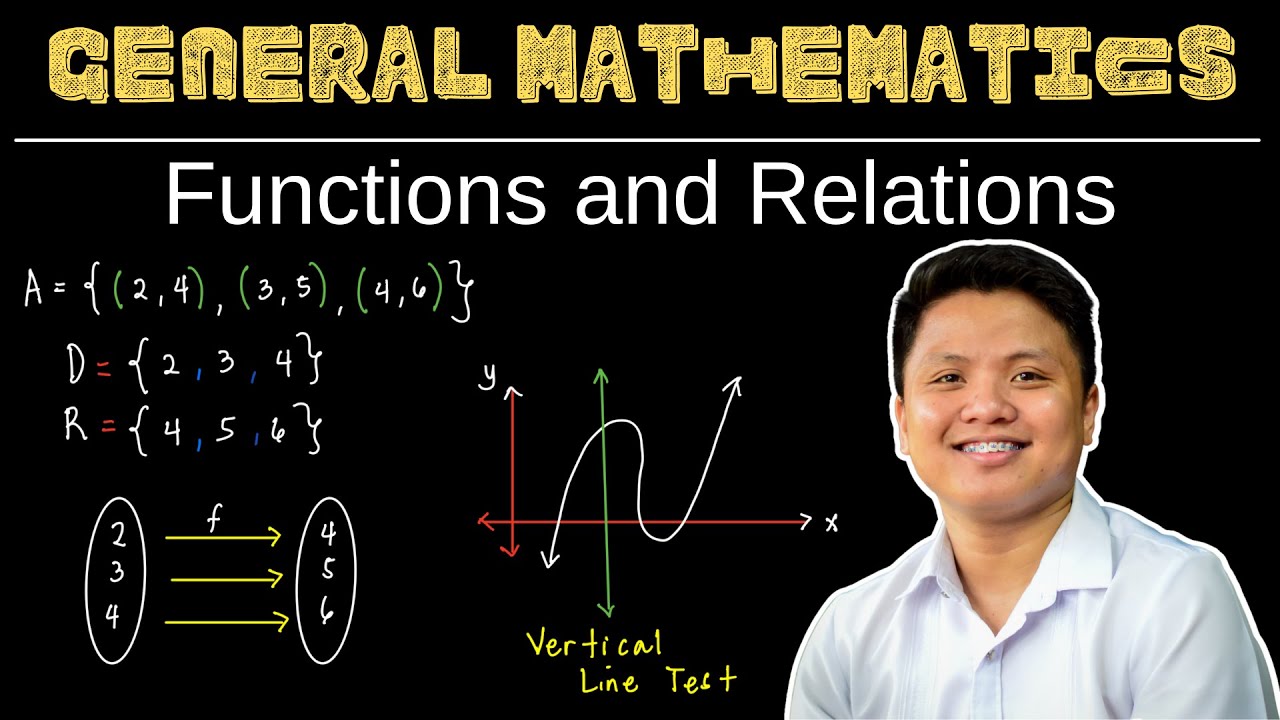
Relations and Functions | Algebra
Relasi dan Fungsi (1) | Menyatakan Relasi | Matematika Kelas 8
Relation and Functions || MATHEMATICS IN THE MODERN WORLD
Pengertian Fungsi - Matematika Kelas XI Kurikulum Merdeka
Lec 06 - Relations
5.0 / 5 (0 votes)