HOW TO TRADE THE 5 AND 13 EMA IN CRYPTO CURRENCY?
Summary
TLDRThis video script offers insights into trading cryptocurrencies using the 5 and 13 EMA (Exponential Moving Averages). It explains the significance of these indicators in identifying market trends and volatility, and provides strategies for taking profit or exiting trades based on their crossovers and price deviations. The presenter emphasizes the importance of combining these moving averages with other technical analysis tools for a comprehensive trading approach.
Takeaways
- 📈 The video discusses using the 5 and 13 EMA (Exponential Moving Averages) to trade in the crypto market.
- ⏰ The importance of understanding the relationship between the 5 and 13 EMA and their behavior in relation to price movements is emphasized.
- 🔍 The script explains that when price deviates from the moving averages, it implies volatility and a potential return to the mean.
- 📊 The concept of 'mean reversion' is introduced as a key concept for understanding moving averages.
- 🟡 The 5 EMA is represented by the yellow line and the 13 EMA by the red line in the video's chart examples.
- 🚀 A common trading rule mentioned is to consider going long if the price is above the 5, 13, and 50 EMAs, and short if below.
- 📉 The video suggests using the crossover of the 5 and 13 EMAs as a signal for potential trade exits or entries.
- 🕒 The difference in signal clarity between the hourly and 15-minute time frames is highlighted, with the latter providing earlier indications.
- 📌 The script stresses the importance of confirming trade signals with additional indicators like RSI and candlestick patterns.
- 🔄 The video explains how to use the 5 and 13 EMA to identify potential entry points for long positions, including watching for price stabilization and crossovers.
- 🛑 It cautions against solely relying on the 5 and 13 EMA for trading decisions, as they are part of a larger 'hybrid system' that requires confluence of multiple factors.
Q & A
What are the two moving averages discussed in the video?
-The two moving averages discussed in the video are the 5 EMA (Exponential Moving Average) and the 13 EMA.
What does EMA stand for?
-EMA stands for Exponential Moving Average, which is a type of moving average that places a greater weight and significance on the most recent data points.
Why are moving averages important in trading?
-Moving averages are important in trading because they help smooth out price data to identify trends and can be used to determine entry and exit points for trades.
What does the video suggest if the price is above the 5, 13, and 50 EMAs?
-If the price is above the 5, 13, and 50 EMAs, the video suggests that traders should only be considering going long, or buying the asset.
What is the significance of the 5 and 13 EMA crossing over?
-The crossing over of the 5 and 13 EMA can signal a potential change in the trend. If the 5 EMA crosses over the 13 EMA to the downside, it might indicate a bearish trend, while a crossover to the upside could suggest a bullish trend.
How can the 15-minute time frame be used in conjunction with the 5 and 13 EMA?
-The 15-minute time frame can be used to get a more granular view of the market action and to spot potential entry or exit points earlier than on the hourly time frame. It can help traders to react more quickly to changes in the 5 and 13 EMA.
What is meant by 'mean reversion' in the context of moving averages?
-Mean reversion is a concept in finance that suggests that asset prices and returns eventually move back towards their mean or average. In the context of moving averages, it refers to the idea that price will return to the level of the moving average after a period of deviation.
How can the behavior of the 5 and 13 EMA be used to determine a potential exit point for a profitable trade?
-Traders can use the behavior of the 5 and 13 EMA to determine a potential exit point by watching for the price to close below both EMAs and for the EMAs to cross over each other. This could indicate that the upward momentum is slowing and that it might be time to take profits.
What is a 'vector candle' mentioned in the video?
-A 'vector candle' is not a standard term in trading, but it seems to refer to a candlestick pattern that shows a strong directional move, either up or down, which can be used to identify potential trend reversals or continuations.
How does the video suggest using the 5 and 13 EMA to establish an entry point for a trade to the upside?
-The video suggests looking for the 5 EMA to cross over the 13 EMA and then for both to cross over the 50 EMA as a potential entry point for a trade to the upside. Additionally, watching for a retrace back towards the EMAs and a stabilization of price can also indicate a favorable entry point.
What is the 'hybrid system' mentioned in the video?
-The 'hybrid system' mentioned in the video is not explicitly defined, but it appears to be a trading strategy or system that incorporates multiple indicators and factors, including the 5 and 13 EMA, to make trading decisions.
Outlines

Dieser Bereich ist nur für Premium-Benutzer verfügbar. Bitte führen Sie ein Upgrade durch, um auf diesen Abschnitt zuzugreifen.
Upgrade durchführenMindmap

Dieser Bereich ist nur für Premium-Benutzer verfügbar. Bitte führen Sie ein Upgrade durch, um auf diesen Abschnitt zuzugreifen.
Upgrade durchführenKeywords

Dieser Bereich ist nur für Premium-Benutzer verfügbar. Bitte führen Sie ein Upgrade durch, um auf diesen Abschnitt zuzugreifen.
Upgrade durchführenHighlights

Dieser Bereich ist nur für Premium-Benutzer verfügbar. Bitte führen Sie ein Upgrade durch, um auf diesen Abschnitt zuzugreifen.
Upgrade durchführenTranscripts

Dieser Bereich ist nur für Premium-Benutzer verfügbar. Bitte führen Sie ein Upgrade durch, um auf diesen Abschnitt zuzugreifen.
Upgrade durchführenWeitere ähnliche Videos ansehen
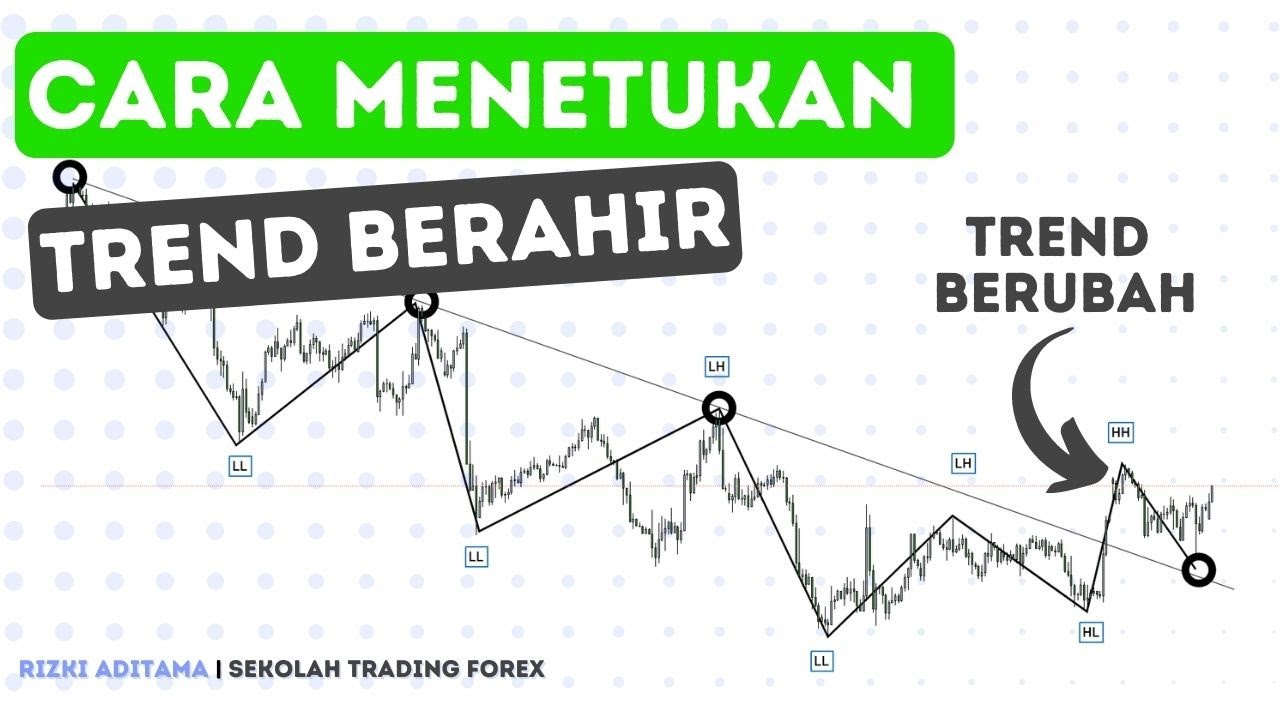
Cara Mengidentifikasi Akhir Sebuah Trend. (Strategi saya)
Moving Averages Explained: Find the Best Stocks to Trade | SMA vs EMA | Vivek Bajaj

Mengapa Konsistensi Profit Lebih Berharga Daripada Entry Sempurna

🔴 3X Better Than MACD & RSI - EMA Trendline Trading (How to Trade Trendlines Perfectly Every Time)
Back Testing 50 kali Vol 5 - Cross over EMA 50 dan EMA 100

Strategi Simpel Ini Bantu Saya Profit 200% di Gold dalam 6 Bulan
5.0 / 5 (0 votes)
