Pattern Recognition - Aussie OTE NYO
Summary
TLDRIn this pattern recognition tutorial, the presenter guides viewers through identifying optimal trade entries using market structure shifts and price levels. Starting at an old high of 77.49, the video demonstrates how to anchor the FibReactive tool to find entry points and profit objectives. It highlights the importance of respecting price levels and market structure, providing a clear strategy for trading with a focus on the 15-minute time frame and emphasizing the significance of overlapping price zones.
Takeaways
- 📈 The video discusses a pattern recognition strategy in trading, focusing on identifying optimal trade entries and profit objectives.
- 📊 The presenter uses a specific price level of 77.49 as an example of an old high that could be a significant institutional level to watch for price action.
- 🔍 A 15-minute time frame is selected to highlight the market structure shift and identify the optimal trade entry points.
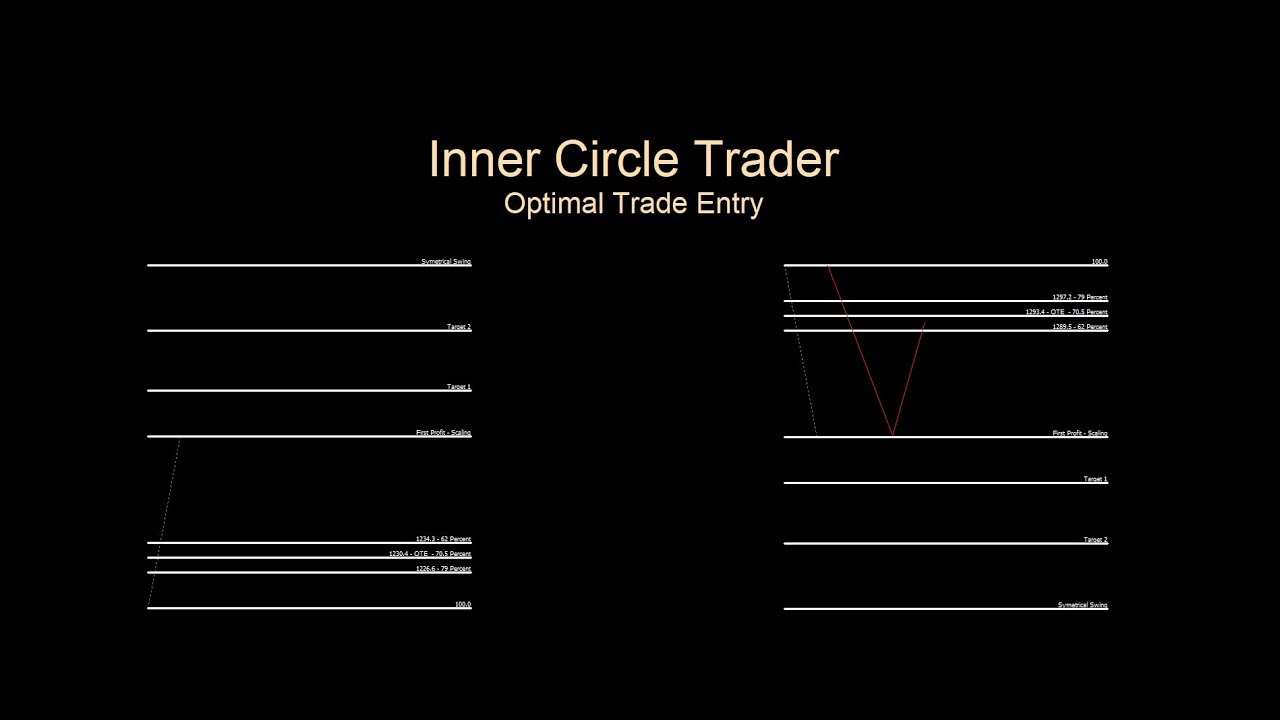
- 📉 The strategy involves using the FibRetracement tool to find support and resistance levels, with a focus on the 50% and 250% levels.
- 📍 The 'impulse price' is identified when a high is taken out, and the Fib tool is used to anchor from the lowest body to the highest body of a candlestick.
- 💰 The optimal trade entry is suggested at the 70.5 level, which is a midpoint between the old high and the current price action.
- 🎯 The old high at 77.49 is considered the first profit objective, and the presenter discusses potential further targets at 77.95, 77.10, and 78.30.
- 📝 The script emphasizes the importance of respecting price levels and market structure in making trading decisions.
- 🌐 The video mentions 'kill zones' which seem to refer to specific price areas where trades should be exited or adjusted.
- 🕒 The presenter notes the significance of time of day and session overlaps, such as between London and New York trading sessions, on price action.
- 📚 The script concludes with a reminder of the importance of pattern recognition and optimal trade entry in successful trading.
Q & A
What is the main topic discussed in the video script?
-The main topic discussed in the video script is pattern recognition in trading, specifically focusing on identifying optimal trade entry points using market structure and price levels.
What is the significance of the old high mentioned in the script?
-The old high, mentioned as 77.49, is a significant price level in the market structure that traders use as a reference point for potential institutional buying or selling pressure.
What does the script suggest should be the first level of interest for institutional traders when the price comes down to 77.49?
-The script suggests that the first level of interest for institutional traders should be 77.50, which is a calibrated level that might act as a support or resistance.
What time frame is recommended for analyzing the market structure in the script?
-The script recommends dropping down to a 15-minute time frame to analyze the market structure and highlight the market structure shift.
How is the 'impulse price' determined in the script?
-The 'impulse price' is determined by taking the lowest body of the candlestick (which could be the open or close) and dragging it up to the highest body of the candlestick, creating a range for potential trade entries.
What is the optimal trade entry mentioned in the script, and how is it calculated?
-The optimal trade entry mentioned in the script is 70.5. It is calculated by using the lowest body of the candlestick as an anchor and extending it to the highest body, creating a level that traders can use to enter trades.
What are the profit objectives and targets mentioned in the script?
-The profit objectives and targets mentioned in the script are the old high, target one, target two, and a symmetrical price ring. These are levels at which traders can expect to take profits or adjust their trades.
What is a 'kill zone' in the context of the script?
-A 'kill zone' in the script refers to a specific price area where the market is expected to reverse or consolidate, providing traders with potential entry points or stop-loss placements.
How does the script suggest identifying a trade entry in the 'kill zone'?
-The script suggests identifying a trade entry in the 'kill zone' by looking for a candlestick that shows respect for a certain price level, such as 70.5, and then observing the market's reaction to that level for potential entry signals.
What is the significance of the 'London just New York' reference in the script?
-The 'London just New York' reference indicates a time when the London market session overlaps with the New York market session, which can lead to increased volatility and potential trading opportunities.
What is the potential upside mentioned in the script, and what does it imply for traders?
-The potential upside mentioned in the script is 77.95, 77.10, and then 78.30. This implies that traders should be prepared for the possibility of the price moving up to these levels, and they should have strategies in place to manage their trades accordingly.
Outlines

Dieser Bereich ist nur für Premium-Benutzer verfügbar. Bitte führen Sie ein Upgrade durch, um auf diesen Abschnitt zuzugreifen.
Upgrade durchführenMindmap

Dieser Bereich ist nur für Premium-Benutzer verfügbar. Bitte führen Sie ein Upgrade durch, um auf diesen Abschnitt zuzugreifen.
Upgrade durchführenKeywords

Dieser Bereich ist nur für Premium-Benutzer verfügbar. Bitte führen Sie ein Upgrade durch, um auf diesen Abschnitt zuzugreifen.
Upgrade durchführenHighlights

Dieser Bereich ist nur für Premium-Benutzer verfügbar. Bitte führen Sie ein Upgrade durch, um auf diesen Abschnitt zuzugreifen.
Upgrade durchführenTranscripts

Dieser Bereich ist nur für Premium-Benutzer verfügbar. Bitte führen Sie ein Upgrade durch, um auf diesen Abschnitt zuzugreifen.
Upgrade durchführen


5.0 / 5 (0 votes)
