4 Dogs Problem: The Inefficient Solution (3b1b SoME#2 Entry)
Summary
TLDR在这段视频中,作者分享了一个有趣的数学谜题:四只狗从正方形的顶点出发,以恒定速度相互追逐,最终在中心相遇。尽管作者花了几周时间才找到自己的解法,但发现网上的解答更简洁。通过实验和图表,作者解释了狗的螺旋运动路径,并证明了它们所走的曲线总长与原正方形的边长相等。视频强调了解决问题过程的重要性,并鼓励观众用不同的方法解决一个问题,而不是单一方法解决多个问题。
Takeaways
- 🧩 一道花费了很长时间才解决的有趣谜题,但最终发现更简单的解决方案。
- 🕵️♂️ 四只狗分别位于边长为一单位的正方形的顶点,并以每秒一单位的速度分别朝向下一只狗移动。
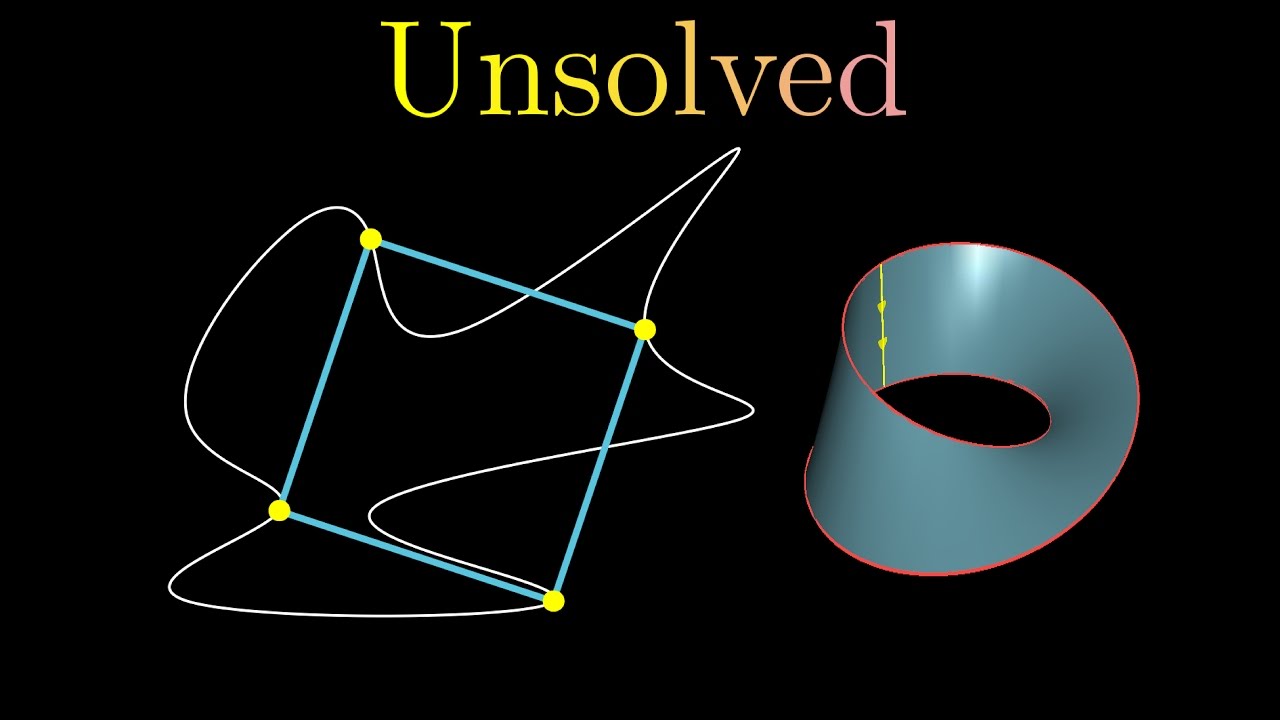
- 🔄 狗的路径不是圆形,而是向中心慢慢螺旋状移动。
- 🧠 假设狗的反应速度有滞后时间 t 秒,以观察它们的路径变化。
- 📉 建立图表,将每一步的距离变化和中间正方形的边长绘制在坐标轴上。
- 🔬 通过图表可以发现路径长度和中间正方形边长之间的关系。
- 📏 即使没有螺旋方程,仍可以通过图表找到狗移动的总距离。
- 📈 证明在 t 接近零时,图表曲线是直线,且斜率为常数。
- 🧮 计算得出总路径长度等于初始正方形的边长。
- ✨ 强调解决问题的过程和思维方法的重要性,比单纯找到答案更有意义。
Q & A
视频开头提到的谜题是什么?
-视频开头提到的谜题是关于四只狗坐在边长为1个单位的正方形顶点上,且每只狗都以1单位/秒的速度朝向下一只狗移动的问题。
谜题中四只狗的移动速度是多少?
-四只狗的移动速度是1单位/秒。
四只狗的移动方向是怎样的?
-第一只狗总是朝向第二只狗移动,第二只狗总是朝向第三只狗移动,第三只狗总是朝向第四只狗移动,第四只狗总是朝向第一只狗移动。
四只狗最终会在什么地方相遇?
-四只狗最终会在正方形的中心相遇。
四只狗的路径会是什么形状?
-四只狗的路径是螺旋状逐渐向中心靠拢。
如何通过实验模拟狗的路径?
-通过设定狗有一个t秒的延迟时间,每隔t秒调整一次方向,可以模拟出螺旋状的路径。随着t值减小,路径逐渐逼近实际情况。
如何测量狗的螺旋路径的长度?
-通过建立一个图表,在x轴上标记每一步的距离,在y轴上标记每一步形成的中间正方形的边长,可以找到狗走到中心的总距离。
如何证明原始情况下的路径是一条直线?
-通过计算延迟情况下的路径斜率,发现其斜率趋于负一,证明了原始路径是一条直线。
图表中y轴为0时对应的x轴值是什么意义?
-y轴为0时对应的x轴值是狗走到中心的总距离,在本例中等于1单位。
视频的核心主题是什么?
-视频的核心主题是解谜的过程本身,而非结果。通过不同方法解决一个问题比单一方法解决多个问题更有价值。
Outlines
😀 解决数学谜题的个人旅程
作者分享了一个自己花了很长时间才解决的谜题的经历,并描述了在找到更短的解决方案后感到沮丧。然而,作者意识到最短的解决方案并不总是最美的,强调了欣赏解决问题过程的重要性。接着,作者提出了一个关于四只狗沿着正方形顶点移动的谜题,并鼓励观众暂停视频自行尝试解决。
🤔 狗的螺旋路径和距离计算
作者详细描述了狗在正方形顶点移动的路径,并通过一个思维实验来理解它们的运动方式。假设狗的方向每隔t秒才会调整一次,作者演示了随着t值减小到零,狗的路径逐渐变成螺旋形。然后,作者提出了计算曲线距离的问题,并指出通过图形来解决这个问题的方法。
🌀 通过图表理解狗的运动路径
作者继续使用思维实验,通过绘制图表来分析狗的运动路径。每一步在x轴上标记一个t距离,在y轴上标记对应的中间正方形的边长。通过这种方法,作者展示了如何利用图表来计算狗移动的总距离,并最终发现,当t趋近于零时,图表实际上是一条直线。这表明狗移动的总距离与正方形的边长相等。
Mindmap
Keywords
💡数学难题
💡狗的运动路径
💡螺旋
💡时间间隔
💡图形
💡极限
💡直线
💡毕达哥拉斯定理
💡函数
💡数学美
Highlights
接下来,我将为你们分享一个非常有趣的谜题,这是一个让我花了很长时间才解决的难题。
我在网上找到了一个非常简短的解决方案,这让我感觉自己很愚蠢,因为我没有想到更简单的方法。
我意识到,最短的解决方案不一定是最美的。我们走的路可能有点长,但只要我们欣赏旅程,它本身就是美丽的。
现在想象你有四只狗,它们坐在边长为一单位的正方形的顶点上。这些狗的速度总是每秒一单位。
第一只狗总是朝着第二只狗移动,第二只狗总是朝着第三只狗移动,第三只狗朝着第四只狗移动,第四只狗又朝着第一只狗移动。
所有狗同时开始移动,它们应该在某个时刻相遇。问题是它们的路径是什么样的,一只狗为了到达相遇点走了多远。
狗不会沿圆周运动,它们会慢慢螺旋向中心移动。
狗的大脑很慢,它们只能在每t秒后改变方向。在每一步之后,它们形成一个比前一步小的中间正方形。
原始的狗应该没有任何滞后时间,它们应该立即朝着正确的方向移动。
狗在x轴上移动t单位的距离,在y轴上移动中间正方形的边长。
这个图表非常有用,知道任何一步的边长,我们可以找到狗到达那一步所走的距离。
中心处的中间正方形的边长为零,这意味着答案是图表在x轴上为零的点。
对于滞后情况的图表,斜率是负一,这是一个常数。
知道斜率和第一个正方形的点,我们可以轻松找到直线方程。
狗走的曲线长度与正方形的边长相等,结果是惊人的美丽。
解决一个问题的五种方法要比解决五个问题的一种方法更好。
Transcripts
in a moment i'll be sharing with you a
very nice puzzle one which i spent my
head on for a long time in fact it took
me weeks to solve it but i felt really
good about myself that i finally did it
but then i decided to look up solutions
online
and guess what
i was devastated the solution i found
online was so short that i felt like a
complete idiot that i couldn't think of
a more easier way
my solution definitely had to be the
most inefficient one
but now when i look back i realized that
the shortest solution is not exclusively
the most beautiful one
the path that we take might be somewhat
long but as long as we appreciate the
journey it surely is beautiful in itself
after all it is mathematics and all math
is clever and beautiful
so yes here's the puzzle
imagine you have four dogs and
they just happen to sit on the vertices
of a square whose side lengths are one
units
the dogs however as you can guess aren't
normal they are mathematically bred in
such a way that their speed is always
one units per second
and that the first dog always moves
towards the second dog the second one
always moves towards the third the third
towards the fourth and the fourth again
always moves towards the first one so
given all these wrong information if
they all began moving at once they
should meet each other at some point in
time so the question is what would their
paths look like and also what is the
distance covered by one of the dogs to
get there
now before proceeding i want you to
press pause and give this a try yourself
trust me the problem is quite rewarding
itself
so back to the puzzle
how do you even figure out the path of
such weird motion
will they run in circles spirals or
something else
for one thing they won't run in circles
no if their directions were always
oriented perpendicularly from the center
then they would have always run around
in circles but this isn't the case here
so they should slowly spiral in towards
the center right
but how do we show of it
well let's design a thought experiment
imagine that the dogs well their brains
are slow so they can only change their
directions after every t seconds
so at first the dogs will start moving
in their initial direction and only
after t seconds their slow brains will
suddenly discover that they are not
running in the right directions
so they'll fix their directions
instantly and start moving towards the
new directions again
and they keep on running in this manner
fixing their directions after every two
seconds
so running in this way gives us a sort
of spiral-like path for our dogs
but this is not the original path
because our original dogs should not
have any lag time at all they should not
fix their directions after a lag time of
t
they should fix it after a lag time of
zero that is they should move towards
the right directions instantly but in
this example where we chose a lag time
of t equals 0.2 seconds let's see what
happens to the path here when we keep on
decreasing the value of t so that it
almost reaches zero
i hope now this starts to make some
sense
yes the path that you see here is the
path our dogs take while moving in their
weird way but
hey this just became a whole lot
difficult how do we even measure the
length of this curved shape
is this even possible
well let's move back to our thought
experiment and explore it a little bit
further
here the dogs had a slow brain with t
seconds of lag time which meant they
could sense any changes only after t
seconds
now notice that a t seconds lag is the
same as calling it a t distant flag
because the dogs having a speed of one
units per second covers the same units
of distance in equally the same units of
time this means instead of saying the
dog sends any changes after t seconds we
can equally say that the dogs sense any
changes just after crossing t units of
distance
here we can see that after each step the
dogs form an intermediate square which
by the way is always smaller than the
previous one
let's name the sides of these squares
the initial one let's call it s1 and
then the next ones as s2 s3 and so on
ok enough notations let's talk business
how do we measure this curve distance
well that's where we start to use some
magic
no not literally we are not chanting
some spells to find out the answer but
what we're about to do at first might
seem a bit weird but the way things work
out at the end
it almost feels like magic
let's start building a graph
but hey we don't know any functions here
i mean it might have helped if we knew
the equation of the spirals at least we
don't even know that what graph are we
gonna make
well let's do a crazy thing we'll start
building a new one
which won't require knowing about the
equation of the spirals at all
again we start with the lag case
here after each step our dogs take we
put one t distance in the x axis which
is the distance covered in that step
and then let's put the side length of
the intermediate square formed after
that step on the y axis
and we keep on doing this for all the
steps
the graph that we see here is amazingly
useful for instance if you know the side
length of an intermediate square at
let's say this step
matching the side length here you'll
know that it took the dogs one two three
steps to reach this point so the
distance caused by them to reach this
step is this length in the x-axis
and this is true for any step if we just
know the side length at any step we can
find out the distance traveled by the
dogs to get to that step just by looking
at the x-coordinate
now this is actually a key discovery
take a moment to realize how this is
true
but how does this help to find the
distance travel to get to the center
well we already know the side length of
the intermediate square in the center
since it's the center the side length
has to be zero
but wait this means our answer is the x
coordinate for which that graph is equal
to zero
but how do we find where this graph is
equal to zero we don't even know the
function yet
okay but before that the graph you see
here is for the t distance lag case
where the dogs had a slow rain what
would the graph look like for the
original case when t approaches zero
this made me question the first time
could it really be that simple is this
graph in the original case actually a
straight line
well it certainly looks like one but how
to prove that it is one
this is the last clever thing we'll need
to solve this once and for all
in fact we don't even need to do much to
prove that it is indeed a straight line
if we can somehow show that the slope is
always the same that will easily prove
our claim because straight lines well
are straight so they don't change their
slopes at all
and finding the slope is relatively
simple for the lag case the slope for
any two consecutive steps would appear
to be the vertical change divided by the
horizontal change
here the horizontal change would be t of
course because we chose the length of
each step in x-axis to be t itself
in case of the vertical chain it will be
the difference of these lengths
let's call this s sub n so the other one
will be s sub n plus one
so the vertical distance becomes s sub n
plus one minus s sub n and the slope
should look like this
now observing our figure we can actually
find a relation between the two
consecutive squares so here if this
square side length is s sub n the next
one should be s sub n plus one
and we can spot a right angle triangle
here and in fact we can easily figure
out the length of the sides of this
triangle with what we already know
now using the pythagorean theorem we can
find the following relation
and since we didn't choose any two
particular squares this formula is
actually applicable for any two
consecutive squares in this figure
now remember our slope we'll use the
value of s sub n plus 1 here and the
slope now looks this way but this is the
slope for the lag case for the original
case the slope will be the limit of this
value when t approaches zero
i am not showing the calculations here
but it turns out this limit is
exactly equal to negative one which is a
constant
so the slope whichever squares you
consider is always a constant
so
there we have it this has got to be a
straight line
and since now we know the value of the
slope and we also know that this line
passes through the point 0 1 which
represents the very first square the dog
started with using these two information
we can figure out the equation of the
straight line quite easily
it turns out when this graph is zero the
x-coordinate is one which means the
length of the curved lines to which our
dogs traveled must also be one
this to me is amazingly beautiful that
the square we started with had the same
length that these curved paths have they
somehow happen to be equal this almost
feels paradoxical
so there we have it now we know our
answer
but this video was never about the
answer it was about the steps we took
that let us hear
and you might disagree but here's a
profound statement to conclude this
video it is better to solve one problem
five different ways than to solve five
problems one way
thanks for watching
and keep matting
you
Weitere ähnliche Videos ansehen
Who cares about topology? (Inscribed rectangle problem)
How I built 21 startups in 2 years
Intro to Algorithms: Crash Course Computer Science #13
Live demo of GPT-4o coding assistant and desktop app
Nuxt Instance Unavailable - Async Code in Vue and Nuxt with the Composition API (+ raffle 🎁)
The Gaussian Integral
5.0 / 5 (0 votes)