CARA MENGGAMBAR GRAFIK PERSAMAAN GARIS LURUS‼️
Summary
TLDRIn this live stream session, the speaker explains how to graph linear equations, providing step-by-step instructions suitable for middle school (grade 8) and high school (grades 10-11) students. The content covers key mathematical concepts such as linear equations, inequalities, and their applications in linear programming. Throughout the video, the speaker breaks down the process of graphing linear equations using examples, highlighting the importance of accuracy and organization. The session aims to build students' confidence in solving these problems and encourages them to like, subscribe, and share the video for further learning.
Takeaways
- 😀 The video explains how to draw the graph of a linear equation, focusing on middle school (grade 8) mathematics.
- 😀 The method is relevant for high school students as well, especially in grade 10–11 for linear equations, inequalities, and linear programming.
- 😀 Start by preparing the X and Y axes on graph paper, ensuring a neat number line.
- 😀 Use the diagonal method: find points by setting X = 0 to calculate Y, and Y = 0 to calculate X.
- 😀 Plot the two points obtained from the equation on the graph.
- 😀 Connect the points with a straight line using a ruler to ensure accuracy.
- 😀 If the solution results in fractions, multiply by the LCM to eliminate them before plotting.
- 😀 Practice drawing multiple examples to become comfortable with different linear equations.
- 😀 Maintaining neatness in drawing and numbering the axes is emphasized for clarity and understanding.
- 😀 The method taught is simple but forms the foundation for more advanced topics like quadratic inequalities and linear programming in higher grades.
- 😀 Students are encouraged to review their work, share the video, and subscribe to reinforce learning.
Q & A
What is the main topic discussed in the script?
-The script primarily discusses how to plot the graph of a linear equation, which is a key topic in mathematics for 8th-grade students and is also applicable in higher-grade subjects like linear inequalities and linear programming.
What class level is the material relevant for?
-The material is intended for 8th-grade students in middle school (SMP) learning about linear equations. However, it is also applicable for 10th-grade students in high school (SMA) studying linear equations, inequalities, and linear programming.
What is the first step in plotting the graph of a linear equation?
-The first step is to identify the equation of the line and then set either the x or y variable to zero. This allows you to find the corresponding values of the other variable, creating two points that can be plotted on the graph.
How do you determine the coordinates for plotting the graph?
-You substitute values for x and y in the equation to get two points. For example, if x = 0, you find the corresponding value for y, and vice versa. These two points are then plotted on the graph.
What is meant by 'making a clean number line' for plotting?
-Making a clean number line means ensuring that the axes are labeled clearly with evenly spaced intervals, making it easier to plot points accurately. This includes labeling both the x-axis and the y-axis correctly.
What is the significance of connecting the plotted points?
-Connecting the plotted points with a straight line represents the graph of the linear equation. This line shows the relationship between the x and y variables, and it can be extended to other points on the plane.
How can linear equations be applied in real-life scenarios?
-Linear equations are used in various real-life applications, such as calculating costs, predicting trends, and solving problems in fields like economics, engineering, and even everyday budgeting.
What is the next concept introduced after linear equations in the transcript?
-The transcript introduces linear inequalities and their applications in higher grades, particularly in 10th and 11th grade. It also touches on linear programming, which is used for optimizing solutions in real-world problems.
Why is it important to understand how to plot graphs of linear equations?
-Understanding how to plot graphs of linear equations is crucial for visualizing mathematical relationships. It provides a practical way to analyze and solve real-world problems, and it serves as a foundation for more complex topics in mathematics.
What tips are given for making the graphing process easier?
-The transcript suggests using a ruler or straightedge to ensure the graph is neat and accurate. It also emphasizes the importance of plotting points carefully, making sure to follow a consistent scale on the axes.
Outlines

Dieser Bereich ist nur für Premium-Benutzer verfügbar. Bitte führen Sie ein Upgrade durch, um auf diesen Abschnitt zuzugreifen.
Upgrade durchführenMindmap

Dieser Bereich ist nur für Premium-Benutzer verfügbar. Bitte führen Sie ein Upgrade durch, um auf diesen Abschnitt zuzugreifen.
Upgrade durchführenKeywords

Dieser Bereich ist nur für Premium-Benutzer verfügbar. Bitte führen Sie ein Upgrade durch, um auf diesen Abschnitt zuzugreifen.
Upgrade durchführenHighlights

Dieser Bereich ist nur für Premium-Benutzer verfügbar. Bitte führen Sie ein Upgrade durch, um auf diesen Abschnitt zuzugreifen.
Upgrade durchführenTranscripts

Dieser Bereich ist nur für Premium-Benutzer verfügbar. Bitte führen Sie ein Upgrade durch, um auf diesen Abschnitt zuzugreifen.
Upgrade durchführenWeitere ähnliche Videos ansehen
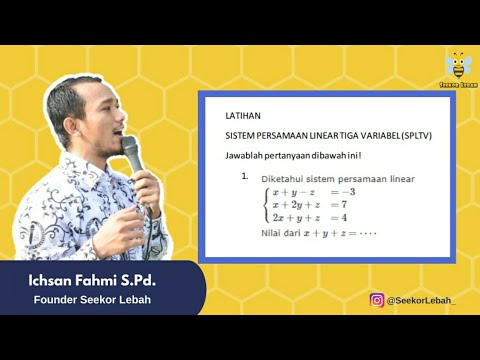
CARA CEPAT FAHAM PERSAMAAN LINEAR TIGA VARIABEL
TRIK MENGUASAI SOAL PERSAMAAN KUADRAT BARU‼️
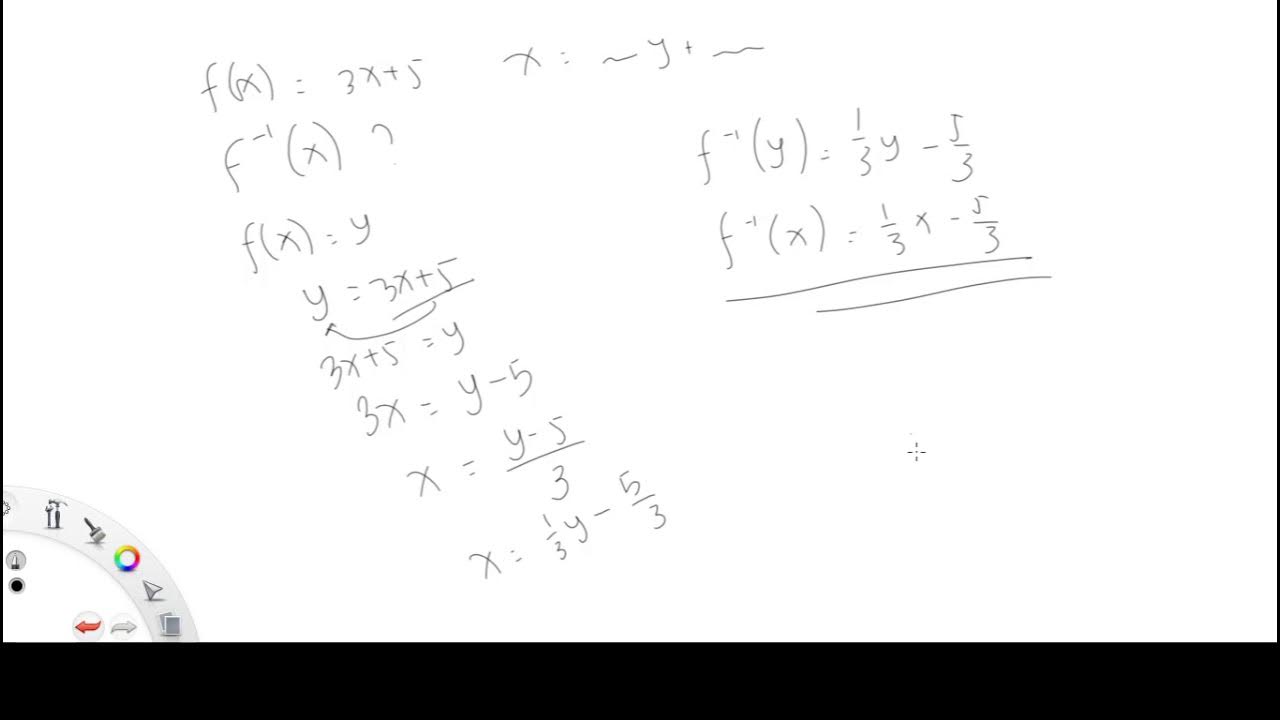
Matematika Teknik 4. Fungsi
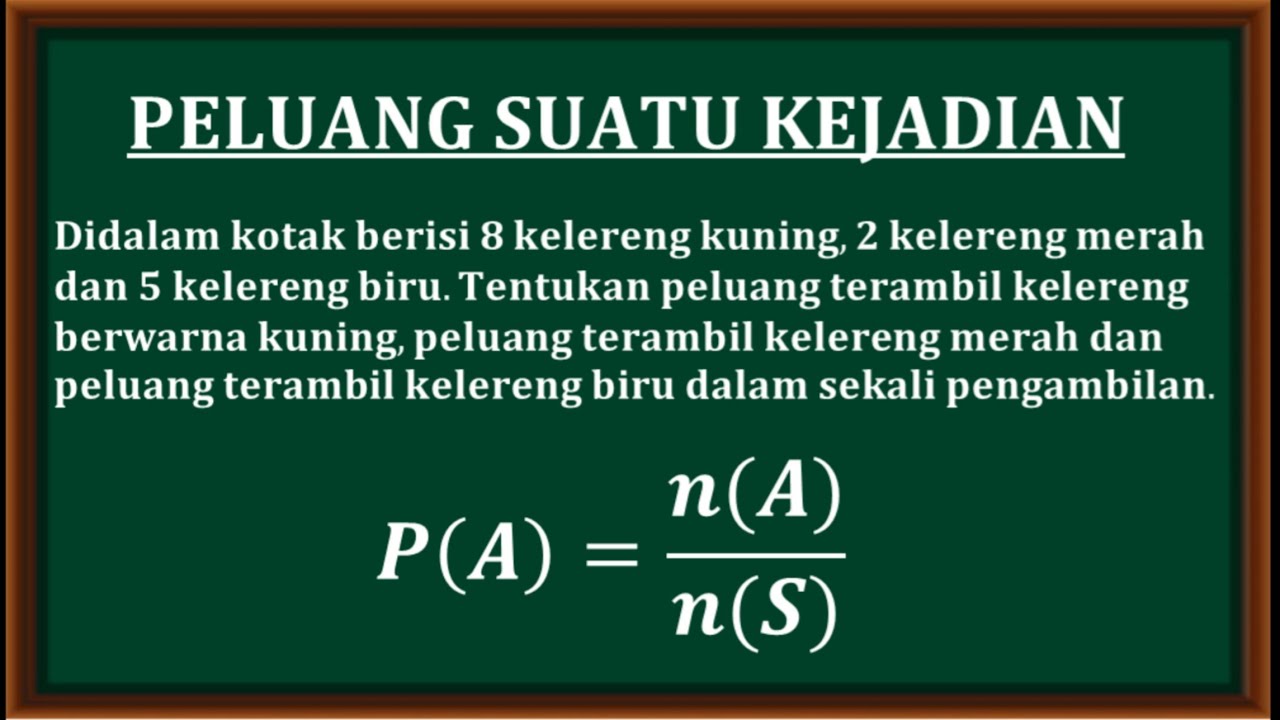
Materi dasar tentang peluang suatu kejadian. Matematika tingkat SMA & SMP

Menentukan Nilai Optimum Menggunakan Metode Uji Titik Sudut (Uji Titik Pojok)

PERSAMAAN LINEAR SATU VARIABEL - MATEMATIKA KELAS 7
5.0 / 5 (0 votes)
