What is Descriptive Statistics? A Beginner's Guide to Descriptive Statistics!
Summary
TLDRThis video provides a comprehensive introduction to descriptive statistics, explaining its purpose in summarizing and analyzing collected data without making inferences about a larger population. It covers key concepts such as measures of central tendency (mean, median, mode) and measures of dispersion (standard deviation, variance, range, interquartile range), illustrating each with practical examples. The video also explains how to organize data using frequency and contingency tables, and how to visualize it effectively with charts like bar charts, pie charts, histograms, box plots, and violin plots. Viewers gain clear insights into understanding, summarizing, and interpreting data for meaningful analysis.
Takeaways
- 😀 Descriptive statistics helps summarize and describe data meaningfully but does not draw conclusions about a larger population.
- 😀 The key components of descriptive statistics include measures of central tendency, measures of dispersion, frequency tables, and charts.
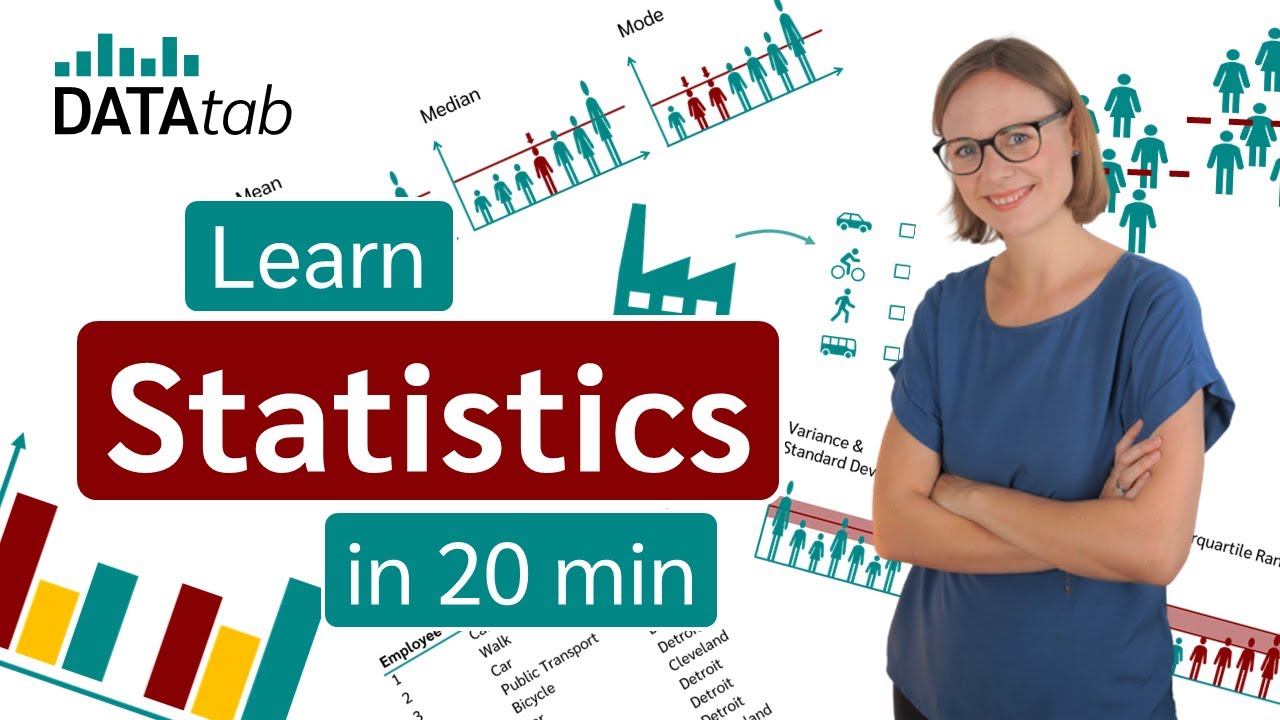
- 😀 Measures of central tendency include the mean, median, and mode, which help represent the central point of a dataset.
- 😀 The mean is calculated by summing all values and dividing by the number of observations, providing an average value.
- 😀 The median is the middle value when data is arranged in ascending order and is resistant to extreme values or outliers.
- 😀 The mode refers to the most frequently occurring value in a dataset, which can be useful for identifying the most common categories.
- 😀 Measures of dispersion, such as standard deviation, variance, and range, describe how spread out the data points are.
- 😀 The standard deviation measures the average deviation from the mean, with two different equations depending on whether the sample or population is being analyzed.
- 😀 The variance is the square of the standard deviation and provides a measure of the spread of data in terms of squared units.
- 😀 Frequency tables summarize how often each value appears in a dataset, while contingency tables help analyze relationships between two categorical variables.
- 😀 Charts, like bar and pie charts, provide visual representations of data distributions and can display either frequencies or percentage values.
Q & A
What is the primary purpose of descriptive statistics?
-Descriptive statistics aim to describe and summarize a collected data set in a meaningful way, without making inferences about a larger population.
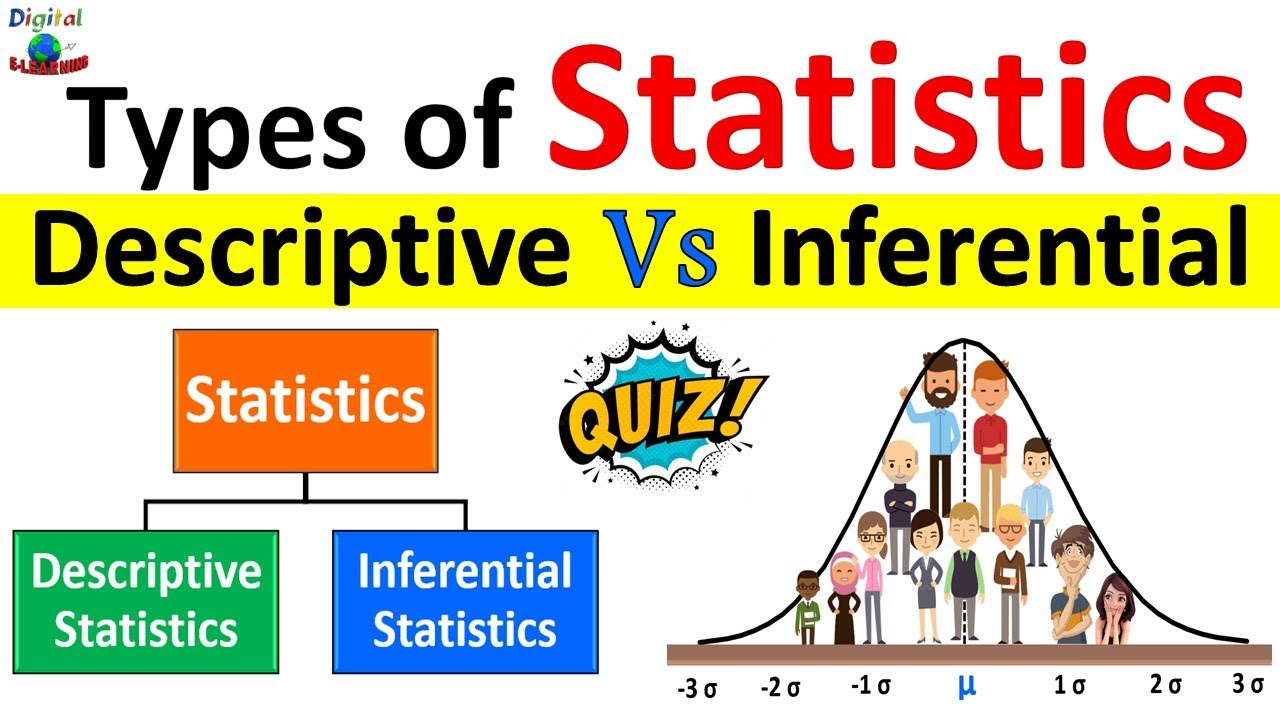
How does descriptive statistics differ from inferential statistics?
-Descriptive statistics summarize the collected data only, whereas inferential statistics use sample data to make generalizations or predictions about a larger population.
What are the three main measures of central tendency?
-The mean, median, and mode are the primary measures of central tendency used to identify the central point of a data set.
Why is the median considered resistant to outliers?
-The median is the middle value in an ordered data set, so extreme values do not affect it, unlike the mean which can be skewed by outliers.
What does the mode represent in a data set?
-The mode is the value that occurs most frequently in a data set.
What are some common measures of dispersion, and what do they indicate?
-Common measures of dispersion include the range, interquartile range (IQR), variance, and standard deviation. They indicate how spread out the data points are around the central value.
How is standard deviation calculated and interpreted?
-Standard deviation is calculated as the average distance of each data point from the mean. It shows how much the values deviate from the mean on average.
What is the difference between a frequency table and a contingency table?
-A frequency table shows how often each value occurs for a single variable, while a contingency table compares the relationship between two categorical variables.
What types of charts are commonly used in descriptive statistics?
-Common charts include bar charts, pie charts, histograms, box plots, violin plots, and rainbow plots, each used to visualize distribution, central tendency, and dispersion.
Why is it important to compare measures of central tendency with measures of dispersion?
-Central tendency shows the center of the data, while dispersion shows how spread out the data is around that center, providing a more complete understanding of the data set.
What does the interquartile range (IQR) represent?
-The interquartile range represents the middle 50% of the data and is calculated as the difference between the third quartile (Q3) and the first quartile (Q1).
How can descriptive statistics help a company understand employee commuting patterns?
-By summarizing survey data using measures of central tendency, dispersion, frequency tables, and charts, a company can identify the most common modes of transport and variations in commuting behavior.
Outlines

Dieser Bereich ist nur für Premium-Benutzer verfügbar. Bitte führen Sie ein Upgrade durch, um auf diesen Abschnitt zuzugreifen.
Upgrade durchführenMindmap

Dieser Bereich ist nur für Premium-Benutzer verfügbar. Bitte führen Sie ein Upgrade durch, um auf diesen Abschnitt zuzugreifen.
Upgrade durchführenKeywords

Dieser Bereich ist nur für Premium-Benutzer verfügbar. Bitte führen Sie ein Upgrade durch, um auf diesen Abschnitt zuzugreifen.
Upgrade durchführenHighlights

Dieser Bereich ist nur für Premium-Benutzer verfügbar. Bitte führen Sie ein Upgrade durch, um auf diesen Abschnitt zuzugreifen.
Upgrade durchführenTranscripts

Dieser Bereich ist nur für Premium-Benutzer verfügbar. Bitte führen Sie ein Upgrade durch, um auf diesen Abschnitt zuzugreifen.
Upgrade durchführenWeitere ähnliche Videos ansehen

KUPAS TUNTAS: Apakah Perbedaan Statistik Inferensial dengan Statistik Deskriptif ?

KUPAS TUNTAS: Apakah Perbedaan Statistik Inferensial dengan Statistik Deskriptif ?
What is Statistics? A Beginner's Guide to Statistics (Data Analytics)!
Descriptive Statistics vs Inferential Statistics | Measure of Central Tendency | Types of Statistics
PERBEDAAN STATISTIK DESKRIPTIF DAN INFERENSIAL

Descriptive Statistics vs Inferential Statistics
5.0 / 5 (0 votes)
