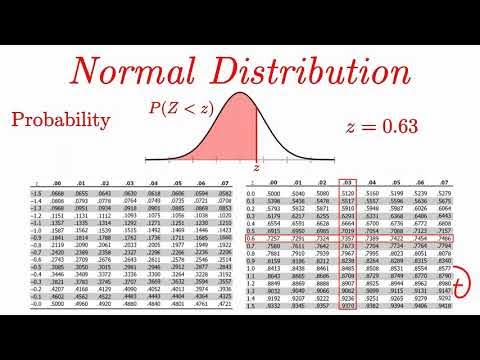
Metode Statistika | Sebaran Peluang Kontinu | Mengenal Sebaran Normal
Summary
TLDRThis video introduces the concept of normal distribution, explaining its significance in probability theory. The script covers the fundamental properties of normal distribution, such as the symmetric bell-shaped curve, the relationship between mean, median, and mode, and the continuous nature of the distribution. The video also delves into the normal density function, emphasizing the parameters of mean (μ) and standard deviation (σ), and how they influence the shape of the curve. Additionally, it explains how variations in these parameters shift the curve, setting the stage for understanding probability in normal distributions.
Takeaways
- 😀 The normal distribution is a type of continuous probability distribution often represented by a bell-shaped curve.
- 😀 The shape of the normal distribution curve is symmetric, meaning the area under the curve on both sides of the mean is identical.
- 😀 The mean, median, and mode of a normal distribution are all equal, indicating that they all coincide at the center of the curve.
- 😀 The normal distribution is used to model random variables in various fields, particularly when the distribution of data is symmetrical and follows a specific pattern.
- 😀 The probability density function (PDF) of a normal distribution is given by the formula: FX = 1 / (√(2π) * σ) * exp[-(x - μ)² / (2σ²)].
- 😀 The normal distribution is defined by two parameters: the mean (μ) and the standard deviation (σ), which control its shape and spread.
- 😀 The mean (μ) represents the center of the distribution, while the standard deviation (σ) measures the spread or variability of the data.
- 😀 When the standard deviation (σ) is large, the normal curve becomes more spread out and flatter. When it's small, the curve becomes more peaked.
- 😀 A large mean shifts the normal curve to the right, while a small mean shifts it to the left, altering the position of the distribution.
- 😀 Despite changes in the mean and standard deviation, the fundamental shape of the normal distribution curve remains consistent.
- 😀 The next topic in the series will discuss the probability related to normal distribution, building on the foundational concepts of this video.
Q & A
What is the normal distribution?
-The normal distribution, often referred to as the bell curve, is a continuous probability distribution that is symmetric about its mean. It is commonly used to describe random variables that are influenced by many small, independent factors.
What is the shape of the normal distribution curve?
-The shape of the normal distribution curve is symmetric and bell-shaped, with the highest point at the mean value. The areas under the curve to the left and right of the mean are equal.
What are the key properties of the normal distribution?
-The key properties include symmetry (the area under the curve is the same on both sides of the mean), the mean, median, and mode being equal, and the distribution being characterized by its bell-shaped curve.
What is the chance density function in normal distribution?
-The chance density function (also known as the probability density function) of a normal distribution is given by the formula: FX = 1 / (√(2π)σ) * exp[-(x - μ)² / (2σ²)], where μ is the mean and σ is the standard deviation.
What do the parameters μ (mu) and σ (sigma) represent in the normal distribution?
-In the normal distribution, μ (mu) represents the mean or central value, while σ (sigma) represents the standard deviation, which measures the spread or diversity of the distribution.
How does the value of μ affect the normal distribution curve?
-As μ (the mean) increases, the center of the normal distribution shifts to the right. Similarly, as μ decreases, the center shifts to the left.
How does the value of σ affect the normal distribution curve?
-A larger value of σ (standard deviation) causes the curve to be more spread out or flattened, while a smaller value of σ makes the curve narrower and more peaked.
What happens to the shape of the normal distribution as the standard deviation increases?
-As the standard deviation increases, the normal distribution curve becomes wider and flatter, indicating greater variability in the data.
How is the normal distribution represented mathematically?
-The normal distribution is represented by the probability density function FX = 1 / (√(2π)σ) * exp[-(x - μ)² / (2σ²)], where μ is the mean and σ is the standard deviation.
What does it mean when a variable is normally distributed?
-A variable is said to be normally distributed if it follows the shape of the normal distribution curve, with the data clustered around the mean and symmetrically distributed on either side.
Outlines

Dieser Bereich ist nur für Premium-Benutzer verfügbar. Bitte führen Sie ein Upgrade durch, um auf diesen Abschnitt zuzugreifen.
Upgrade durchführenMindmap

Dieser Bereich ist nur für Premium-Benutzer verfügbar. Bitte führen Sie ein Upgrade durch, um auf diesen Abschnitt zuzugreifen.
Upgrade durchführenKeywords

Dieser Bereich ist nur für Premium-Benutzer verfügbar. Bitte führen Sie ein Upgrade durch, um auf diesen Abschnitt zuzugreifen.
Upgrade durchführenHighlights

Dieser Bereich ist nur für Premium-Benutzer verfügbar. Bitte führen Sie ein Upgrade durch, um auf diesen Abschnitt zuzugreifen.
Upgrade durchführenTranscripts

Dieser Bereich ist nur für Premium-Benutzer verfügbar. Bitte führen Sie ein Upgrade durch, um auf diesen Abschnitt zuzugreifen.
Upgrade durchführenWeitere ähnliche Videos ansehen

Distribusi Normal Bagian 1 Matematika Minat Kelas XII Semester 2

Weibull Distribution and Moment generating function (mgf) of Weibull Distribution in statistics|

Normal Distribution EXPLAINED with Examples

The Normal Approximation to the Binomial Distribution

Joint Probability Distribution

Probability Theory L51a Section 5.8 Part 1 Chebyshev's Inequality and Convergence in Probability
5.0 / 5 (0 votes)
