Linear Programming dengan Metode Grafik
Summary
TLDRThis video provides a comprehensive overview of linear programming using graphical methods. It explains the essential steps in formulating linear programming problems, such as defining decision variables, setting up objective functions for profit maximization or cost minimization, and establishing constraints. Through practical examples, including furniture manufacturing and diet planning, the video demonstrates how to create mathematical models and solve them graphically. The video emphasizes the importance of constraints, non-negativity conditions, and finding optimal solutions, while also discussing the limitations of graphical methods for problems with more than two decision variables.
Takeaways
- 😀 Linear programming is a mathematical technique used for optimization, which involves maximizing or minimizing a specific objective function.
- 😀 The first step in solving linear programming problems is identifying the objective, which could be either maximizing profit or minimizing costs.
- 😀 Decision variables must be clearly defined in linear programming problems. For example, the number of tables and chairs to be produced could be the decision variables.
- 😀 The objective function is formed based on the problem, such as maximizing profit or minimizing production costs. In the case of furniture production, the objective was to maximize profit.
- 😀 Constraints in linear programming represent limitations or restrictions, such as the maximum available working hours or the amount of materials required for production.
- 😀 Negative values for decision variables must be avoided, meaning that the variables must be greater than or equal to zero.
- 😀 In the furniture production example, the company aimed to maximize profit by determining how many tables and chairs to produce given time and material constraints.
- 😀 For the second example, a nutritionist designed a diet plan using two types of foods (A and B) while considering vitamin and protein content, with the goal of minimizing production costs.
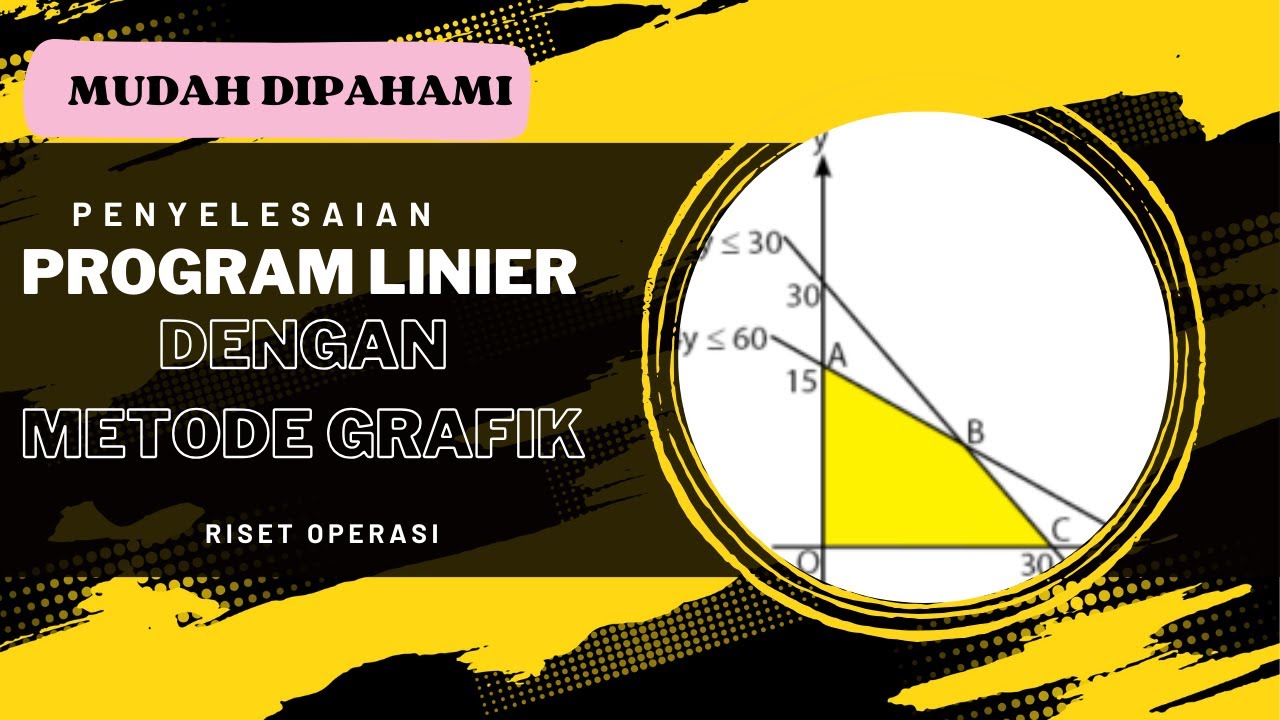
- 😀 Linear programming problems often involve graphical solutions where feasible regions are plotted, and the optimal solution is found at the intersection points of constraints.
- 😀 A solution to a linear programming problem can be found by identifying the feasible region and calculating the value of the objective function at each vertex of the feasible region.
- 😀 Graphical methods for linear programming are most effective for problems with two decision variables. More variables require more advanced methods like the simplex method.
Q & A
What is the primary goal of Linear Programming as introduced in the video?
-The primary goal of Linear Programming (LP) is to find the best outcome, such as maximizing profit or minimizing costs, under a set of given constraints.
How do you define the decision variables in a Linear Programming problem?
-Decision variables are defined based on what needs to be decided or optimized. For example, in the furniture example, the decision variables are the number of tables (x1) and chairs (x2) to be produced.
What is an objective function in Linear Programming?
-An objective function in LP represents the goal of the problem, which is either maximization or minimization. In the furniture example, the objective function is to maximize the profit, expressed as 70x1 + 5x2.
What are constraints in Linear Programming, and how are they formed?
-Constraints are limitations or restrictions on the decision variables. They are formed based on available resources, such as production time, material, or other limitations. For example, the furniture problem includes constraints like production time and painting time for both tables and chairs.
How do you handle non-negativity constraints in Linear Programming?
-Non-negativity constraints ensure that the decision variables cannot take negative values. In the furniture example, the decision variables x1 and x2 must satisfy the condition x1 ≥ 0 and x2 ≥ 0.
What method does the video suggest for solving Linear Programming problems with two variables?
-The video suggests using the graphical method to solve Linear Programming problems with two decision variables. This involves plotting the constraints on a graph to find the feasible region and evaluating the objective function at the vertices of the region.
In the furniture example, what were the available resources and their limitations?
-In the furniture example, the available resources were production time and painting time. The constraints were that there were 240 hours of production time and 100 hours of painting time available per week.
Why is the graphical method only useful for problems with two decision variables?
-The graphical method is only practical for problems with two decision variables because it involves plotting the constraints on a 2D graph. As the number of variables increases, the graphical representation becomes too complex and difficult to interpret.
What is the significance of the intersection points in the graphical method?
-The intersection points of the constraints represent the potential solutions to the Linear Programming problem. By evaluating the objective function at these points, you can find the optimal solution that maximizes or minimizes the desired outcome.
In the diet planning example, what were the main objectives and constraints?
-In the diet planning example, the main objective was to minimize the cost of producing two types of food while meeting minimum requirements for vitamins and proteins. The constraints were the minimum amounts of vitamin and protein that had to be met by the two food types.
Outlines

Dieser Bereich ist nur für Premium-Benutzer verfügbar. Bitte führen Sie ein Upgrade durch, um auf diesen Abschnitt zuzugreifen.
Upgrade durchführenMindmap

Dieser Bereich ist nur für Premium-Benutzer verfügbar. Bitte führen Sie ein Upgrade durch, um auf diesen Abschnitt zuzugreifen.
Upgrade durchführenKeywords

Dieser Bereich ist nur für Premium-Benutzer verfügbar. Bitte führen Sie ein Upgrade durch, um auf diesen Abschnitt zuzugreifen.
Upgrade durchführenHighlights

Dieser Bereich ist nur für Premium-Benutzer verfügbar. Bitte führen Sie ein Upgrade durch, um auf diesen Abschnitt zuzugreifen.
Upgrade durchführenTranscripts

Dieser Bereich ist nur für Premium-Benutzer verfügbar. Bitte führen Sie ein Upgrade durch, um auf diesen Abschnitt zuzugreifen.
Upgrade durchführenWeitere ähnliche Videos ansehen


5.0 / 5 (0 votes)
