19 Oktober 2024
Summary
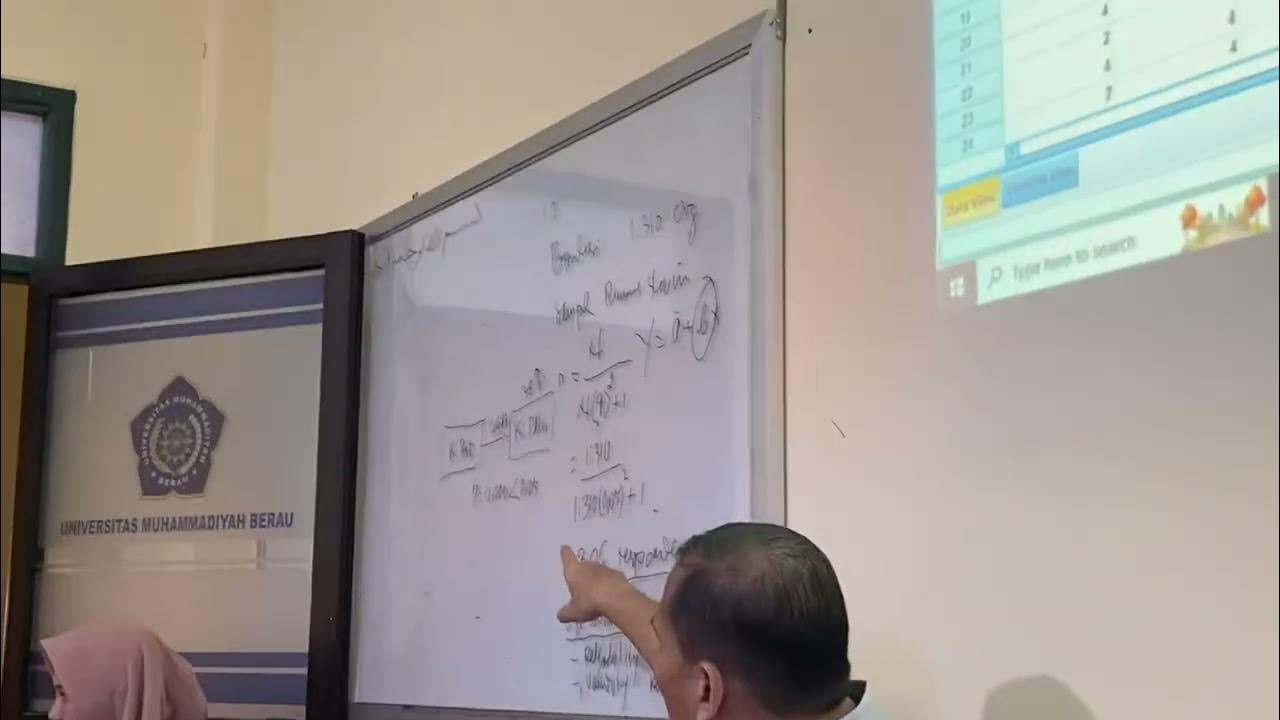
TLDRThe video script outlines a detailed tutorial on using SPSS and AMOS for statistical analysis. It demonstrates how to manage independent and dependent variables, handle missing data, and perform regression analysis. Key steps include calling data, labeling variables, checking for missing values, and interpreting output. The session emphasizes the importance of meeting instrument testing criteria, specifically focusing on the threshold for Cronbach's alpha (typically 0.6) to ensure reliable data processing. The presenter also contrasts the use of graphical analysis with traditional tabular methods, providing practical insights for statistical modeling and presentation.
Takeaways
- 😀 The process involves using SPSS and AMOS for statistical analysis, focusing on regression and data manipulation.
- 😀 The first step is to import the data into SPSS and ensure all variables are properly labeled.
- 😀 When preparing the data, it's important to check for missing values and address them before proceeding.
- 😀 For regression analysis, the data file must be saved and variables should be named appropriately for clarity.
- 😀 SPSS allows you to view variables and their effects, such as how product quality impacts purchasing decisions.
- 😀 Data handling includes confirming that all necessary checkboxes are ticked before performing any analysis.
- 😀 Regression analysis can be done visually in AMOS, providing a more intuitive understanding of data relationships.
- 😀 The result of regression analysis, such as the product quality's influence on purchase decisions, is shown directly in AMOS without needing to refer to tables.
- 😀 A key statistic in regression analysis is the beta value, which indicates the strength of the relationship between variables.
- 😀 A typical threshold for acceptable reliability in statistical testing is a value greater than 0.6, though some situations may require a higher value (e.g., 0.7).
- 😀 The session concludes with an introduction to descriptive statistics, which will be covered in the next class.
Q & A
What is the first step in processing the data in the script?
-The first step is to activate the photocopy machine, represented as an independent variable, which is then transferred into the duplication process.
How are the variables labeled in the process?
-The variables are labeled by double-clicking to open the naming field and entering the appropriate labels, such as 'product quality' and 'purchase decision.'
How do you load data in SPSS?
-To load data in SPSS, you click 'File', then 'Open', and locate the saved dataset from your documents.
What does 'missing data' refer to in the script?
-Missing data refers to any data points that are absent or incomplete in the dataset, which need to be addressed before analysis.
How is missing data identified in SPSS?
-Missing data is identified by checking for gaps or blank cells in the dataset, and you can view how many missing entries there are using SPSS's data inspection tools.
What is the significance of the 'regression results' mentioned?
-The regression results show the relationship between independent and dependent variables, with an example showing a 40% impact of product quality on purchasing decisions.
What does the 0.6 and 0.399 numbers represent?
-The 0.6 represents the beta coefficient in Amos, showing the strength of the relationship, while 0.399 (or 40%) is the regression result from SPSS, showing the percentage impact of product quality on purchase decisions.
Why is using Amos preferred over SPSS tables in the script?
-Amos is preferred because it provides a graphical representation of the data, making the results easier to visualize and present, whereas SPSS relies on tables.
What is the ultimate goal of the analysis described in the script?
-The ultimate goal is to test the instrument and ensure that it meets the necessary requirements, particularly a reliability score of 0.6 or above.
What will be covered in the next lesson after the current analysis?
-The next lesson will focus on descriptive statistics, following the completion of the instrument testing discussed in the current session.
Outlines

Dieser Bereich ist nur für Premium-Benutzer verfügbar. Bitte führen Sie ein Upgrade durch, um auf diesen Abschnitt zuzugreifen.
Upgrade durchführenMindmap

Dieser Bereich ist nur für Premium-Benutzer verfügbar. Bitte führen Sie ein Upgrade durch, um auf diesen Abschnitt zuzugreifen.
Upgrade durchführenKeywords

Dieser Bereich ist nur für Premium-Benutzer verfügbar. Bitte führen Sie ein Upgrade durch, um auf diesen Abschnitt zuzugreifen.
Upgrade durchführenHighlights

Dieser Bereich ist nur für Premium-Benutzer verfügbar. Bitte führen Sie ein Upgrade durch, um auf diesen Abschnitt zuzugreifen.
Upgrade durchführenTranscripts

Dieser Bereich ist nur für Premium-Benutzer verfügbar. Bitte führen Sie ein Upgrade durch, um auf diesen Abschnitt zuzugreifen.
Upgrade durchführenWeitere ähnliche Videos ansehen

19 Oktober 2024

CARA MEMASUKKAN DATA KUESIONER KE SPSS - Beserta Uji Statistik Deskriptif

Pengenalan SPSS bagi Pemula - Pertemuan 5

Tutorial Analisis Korelasi Pearson dengan SPSS

SPSS tutorial in tamil for beginners part -1 | Introduction

Cara Memasukkan Data Awal Sampai Pengolahan Data dari Excel ke SPSS
5.0 / 5 (0 votes)
