#BITCOIN READY TO FOR A MAJOR MOVE?!?
Summary
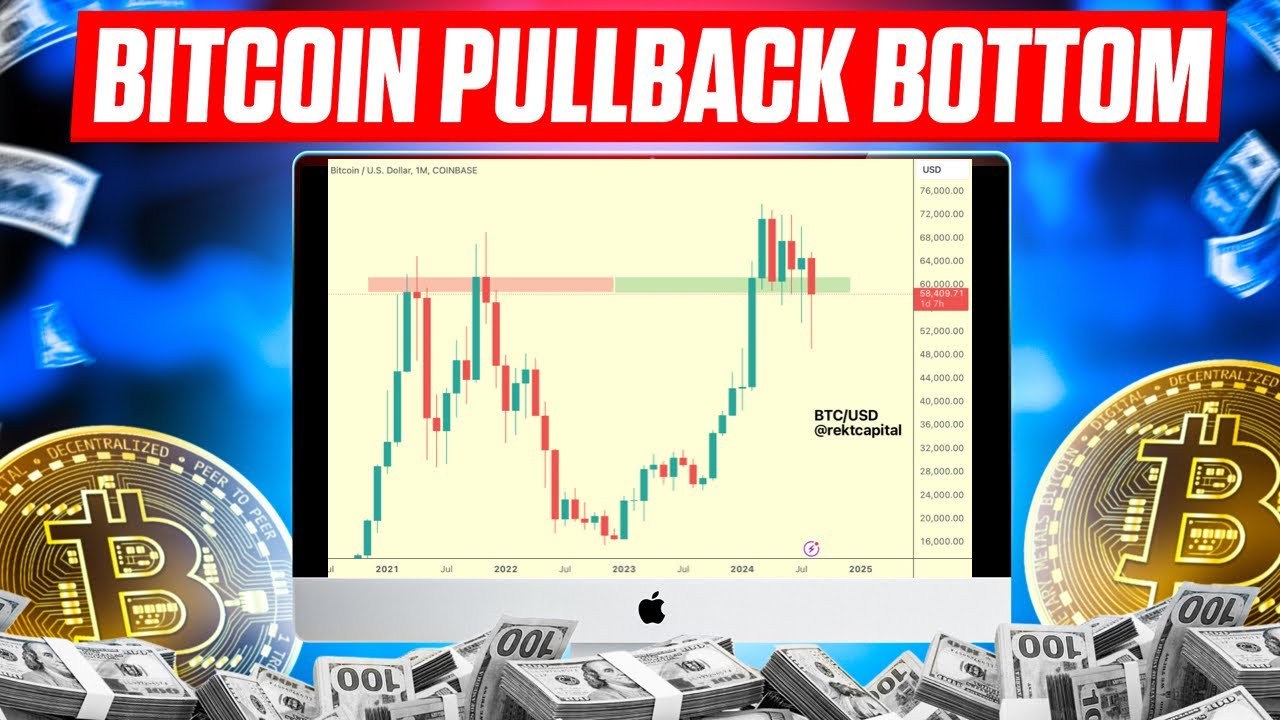
TLDRThe video discusses Bitcoin's current price action, focusing on a descending broadening wedge pattern. After a period of lower highs and lows, Bitcoin is just 16% away from an all-time high. The speaker highlights recent price resistance levels, the importance of the 128-day simple moving average (SMA), and how breaking above these could signal a major bullish trend. Despite short-term risks, long-term prospects are optimistic, with potential for Bitcoin to reach $102,000 within six months, supported by a recent breakout in the weekly RSI. The video emphasizes staying informed and engaged in the market.
Takeaways
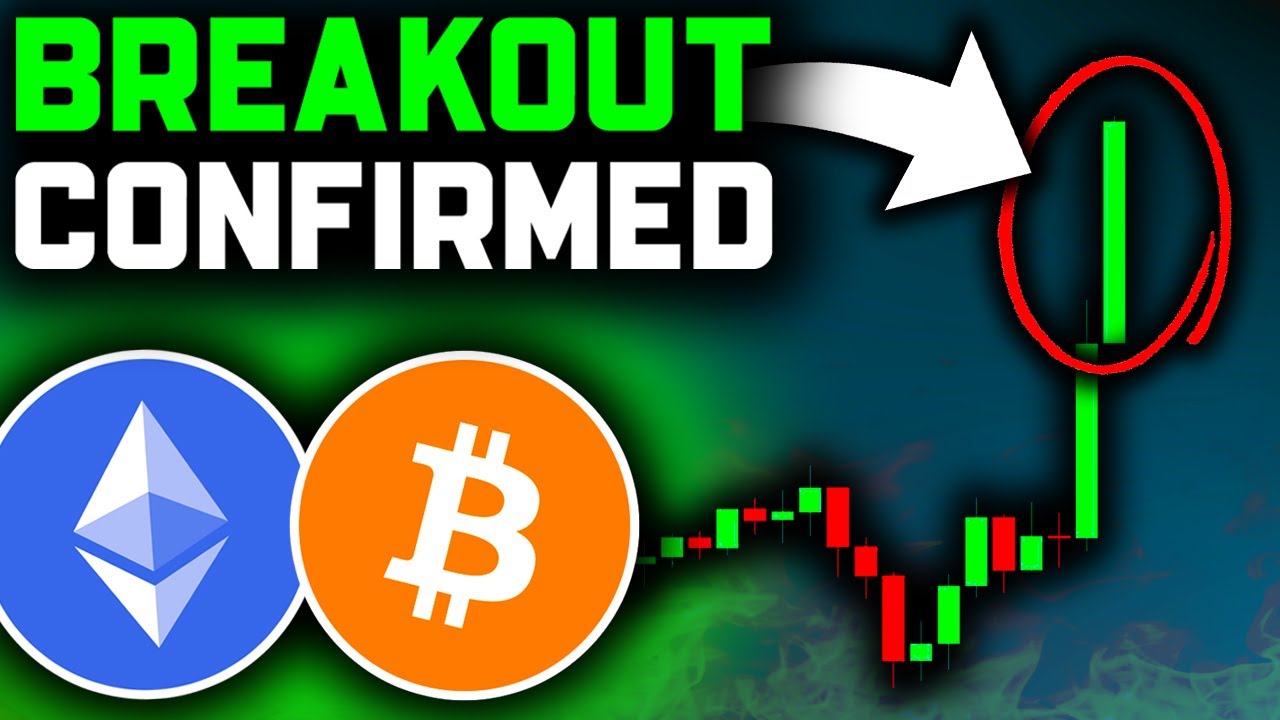
- 📈 Bitcoin's chart recently showed a lower high around the $60,000 level, but sentiment has since improved with a breakout above resistance.
- 🚀 The video discusses a descending broadening wedge pattern in Bitcoin's chart, indicating a potential for a significant price movement.
- 📅 Bitcoin is close to achieving its first major higher high since August 25th, which could signal a bullish trend continuation.
- 📊 A breakout on the Daily RSI suggests strength in the recent uptrend, aligning with the price action.
- 🌟 The presenter is bullish on Bitcoin, predicting new all-time highs by the end of the year, likely in Q4.
- 📉 There is a mention of potential short-term downside risk with Bitcoin retesting the breakout zone before a significant move up.
- 📉 The descending broadening wedge pattern is considered difficult to trade due to the nature of lower highs and even lower lows.
- 📊 The 128-day SMA is highlighted as a significant moving average, historically playing a role in past cycles as support and resistance.
- 🌐 The presenter notes that the market is in a macro uptrend, with the Bulls in control since the beginning of 2023.
- 💹 If Bitcoin breaks above the $65,000 level, it could lead to a significant increase in confidence and a push to new all-time highs.
- 📉 The S&P 500's performance is tied to Bitcoin's, as there has never been a new Bitcoin all-time high without the S&P reaching new highs first.
Q & A
What was the situation with Bitcoin's chart just the other day?
-Just the other day, Bitcoin's chart showed another lower high around the 60,000 level, with bleak sentiment and frustrated investors.
What changed in the Bitcoin market after the FED and the Bulls stepped in?
-After the FED stepped in and the Bulls stepped in, Bitcoin broke above resistance and was very close to getting its first major higher high on the chart.
What is a descending broadening wedge pattern?
-A descending broadening wedge pattern is a chart pattern characterized by lower highs and even lower lows, making it difficult to anticipate and navigate for profit.
How close is Bitcoin to reaching an all-time high from its current price?
-From the current price, Bitcoin only needs to go up by 16% to reach a new all-time high.
What is the significance of the daily RSI breakout mentioned in the script?
-The daily RSI breakout indicates a shift in momentum, suggesting that the bullish trend might continue.
What is the current state of the market according to the script?
-As of September 25th, Bitcoin is hanging around 63,500, with the market experiencing a bit of a flat day.
What is the potential target for Bitcoin if it breaks out of the descending broadening wedge pattern?
-The potential target for Bitcoin, if it breaks out of the pattern, is $102,000 according to the textbook.
What is the role of the 128-day SMA in Bitcoin's past cycles?
-The 128-day SMA has been a significant support and resistance level in past cycles, marking key breakouts and breakdowns.
How many days has Bitcoin been above the 128-day SMA as of the script's recording?
-As of the script's recording, Bitcoin has been above the 128-day SMA for six days.
What is the correlation between the S&P 500 and Bitcoin all-time highs?
-There has never been a new Bitcoin all-time high without the S&P 500 first reaching new all-time highs.
What is the significance of breaking the weekly RSI downtrend?
-Breaking the weekly RSI downtrend suggests at least six months to a year of upside in the market.
Outlines
📈 Bitcoin's Bullish Breakout Potential
The speaker discusses the recent changes in Bitcoin's chart, noting a shift from a bleak outlook with lower highs around the $60,000 level to a bullish intervention by the FED and market participants that pushed prices above resistance. The chart is described to be in a descending broadening wedge pattern, with Bitcoin close to achieving a significant higher high, which would be the first since August 25th. The video also mentions a breakout on the Daily RSI, indicating a potential upward movement. The speaker emphasizes the rapid changes in the market and how a 16% increase from the current price could lead to a new all-time high, changing market narratives. The video is dated September 25th, and Bitcoin is trading around $63,500, with the market experiencing a flat day. The speaker also discusses the importance of the 128-day SMA as a historical support and resistance level and the potential for a substantial breakout if Bitcoin can maintain levels above this moving average.
🚀 Analyzing Bitcoin's Long-Term Pattern and Future Predictions
In this paragraph, the focus is on Bitcoin's descending broadening wedge pattern on the daily chart and its implications. The speaker explains that this pattern is challenging to navigate due to the alternating lower highs and lows. Despite the difficulty, the speaker remains optimistic about Bitcoin's potential to reach new all-time highs by the end of the year, possibly in Q4. They mention the possibility of a short-term downside risk where Bitcoin might retest the breakout zone before a significant upward move. The speaker also discusses the importance of the S&P 500, which they believe must remain above its breakout zone for Bitcoin to follow suit. They highlight the 128-day SMA's historical significance and its current role as a support level. The paragraph concludes with a prediction based on the pattern's textbook target, suggesting a potential price of $102,000 for Bitcoin, contingent on a breakout and maintaining the upward trend. The speaker also mentions the channel's viewership and engagement, encouraging subscriptions and Patreon support for exclusive content and interaction.
Mindmap
Keywords
💡Bitcoin
💡Chart
💡FED
💡Bulls
💡Resistance
💡Descending Broadening Wedge
💡RSI
💡All-time high
💡Macro uptrend
💡128 day SMA
💡Patreon
Highlights
Bitcoin experienced a lower high around the 60,000 level, causing negative sentiment among investors.
The FED's intervention and bullish activity led to a break above resistance, indicating a potential change in market trend.
Bitcoin is approaching its first major higher high on the chart since August 25th.
A breakout on the Daily RSI suggests a potential bullish trend for Bitcoin.
The market is currently stable with Bitcoin at around 63,500, hinting at a potential for rapid change.
A 16% increase from current prices could set a new all-time high for Bitcoin.
The channel's subscriber count is nearing 880,000, with a call to action for viewers to subscribe.
Bitcoin's descending broadening wedge pattern is difficult to navigate and profit from due to lower highs and lower lows.
The daily RSI aligns with price action, indicating a potential for a short-term downside risk.
The long-term macro uptrend suggests that current market fluctuations are minor in the grand scheme.
The monthly line chart shows Bitcoin building support on previous 2021 resistance, indicating a positive long-term trend.
The 128-day SMA has been significant in past cycles, and Bitcoin is currently maintaining levels above it.
A higher high on the chart would signal a strong vote of confidence from the bulls.
The S&P 500's performance often precedes Bitcoin's all-time highs, with the S&P currently at new highs.
The textbook projection from the descending broadening wedge pattern suggests a potential target of $102,000 for Bitcoin.
A weekly RSI breakout typically indicates at least six months to a year of upside for Bitcoin.
The channel is offering a Patreon with exclusive benefits like morning voice chats and access to a Discord community.
Transcripts
just the other day bitcoin's chart
looked something like this where we had
another lower high on the chart just
around that 60,000 level it looked Bleak
sentiment was down people were upset
bored frustrated and then things changed
the FED stepped in the Bulls stepped in
and we broke above that resistance this
is a descending broadening wedge pattern
and we are very close to getting our
first major higher high on the chart the
August 25th high if you just Mark that
up Bitcoin came within just a few Pips
of actually breaking that we even saw a
breakout on The Daily RSI so where are
we headed next that is what we're going
to discuss in today's
video what is up guys welcome back to
the channel today is September 25th it
is Wednesday middle of the week and
Bitcoin is hanging out around 63 and a
half th000 the market stalled a little
bit today the S&P 500 is sitting just
below neutral Bitcoin is kind of just
hanging out at these these recent local
highs a bit of a flat day in the market
but I think people forget just how close
we are to the all-time high measuring
from current prices if Bitcoin were to
go up 16% that's a new all-time high
just 16% which means that if any one of
these weekly candles these types of
moves showed up on the chart right now
well just drag this candle over place it
right where we are if next week looked
something like that there we go all all
of a sudden the picture changes the
narratives change and we're off right
just like that I just want you guys to
remember things can change quickly in
this market in the last video I made
some intros and stuff like that that you
guys loved and I don't have one today
but there's going to be many more of
those coming the response and the
comments was overwhelmingly positive and
so definitely look out for that
subscribe if you haven't subscribed I
noticed that about 20% over 20% of my
viewers are not subscribed to this
channel and we're near 880,000
subscribers so if we had a 20% pump in
subscribers we could hit the 100,000
subscriber Mark so definitely click that
button below now moving on to bitcoin's
descending broadening wedge on the daily
chart what we mentioned at the beginning
of the video Bitcoin has bounced off of
the heartline of this pattern just the
other day September 16th 17th we bounced
got support on the midline a descending
broadening wedge pattern is one of the
most difficult patterns to anticipate
and navigate and profit from it's very
difficult to profit from a pattern like
this because you're getting lower Highs
but you're getting even lower lows and
anticipating those lower lows is really
difficult I think this plays into why
people have been so frustrated recently
throughout the past many months in
crypto because they just couldn't quite
get it right and I think that goes for a
lot of us it was kind of hard to predict
this outcome but here we are 16% away
from the all-time high not very far away
but we do have some resistance above us
to get through the RSI on The Daily also
lines up with the price action here we
had lower highs higher lows and we broke
out now obviously you guys know I'm very
bullish on this Market bullish on
bitcoin I think we're going to hit new
all-time highs this year before the end
of the year most likely going into Q4
but there is some downside risk in the
short term which would be Bitcoin
retesting the breakout Zone and then
settling up before actually getting a
breakout retesting the RSI resistance as
new support around that 50 level before
getting to overbought levels those types
of moves are always possible and
shouldn't be discounted but in the long
term that type of a move is really
nothing it's just a bunch of noise a
bunch of nonsense within the midst of a
macro uptrend as we were talking about
you know all it takes is one or two
weeks if it's really good one or two
weeks you're we're at a new all-time
high just 16% away from the alltime high
we're in a macro uptrend so the Bulls
are the ones in control have been in
control since the beginning of 2023 if
you take a look at the monthly line
chart look at this monthly line chart
right imagine if you were only looking
at the monthly line chart and then you
looked at crypto social media going
bananas going panicking on every dip if
you were just looking at this chart you
would you wouldn't even understand why
they were upset or panicking or
frustrated we're doing really well we're
building support on the previous 2021
resistance so big picture things are
looking really good so looking at the
monthly candles you can see that we are
closing our month L candles the market
is settling up at the previous peak of
the last cycle where we settled up in
the last cycle Bulls are in control
right now now we are sitting right right
next to resistance here that previous
lower high and if we create a higher
high on the chart that is a strong vote
of confidence from the Bulls and if we
just pull up my favorite moving average
which is the 128 day SMA this moving
average has played a huge role in past
Cycles being the main support in 2017
being the breakdown Zone the resistance
in 2017 and it also marked right around
that breakout in 2019 and the breakdown
in 2019 so the market is definitely
keeping up with this moving average
using as resistance and support right
breakdown zone right there major support
right here 2021 and um yeah we've had a
couple lows below this Zone as of
recently but I like to see that right
now we are starting to hold above it
we've now had 1 2 3 4 5 today 6 days
above the 128 day SMA and the Bulls are
really doing a good job so far of
maintaining levels above this and so if
they continue to do that more likely we
break out above resistance and that
would be the first higher high on the
chart since March the first major
discernable higher high I should say so
that would be a huge deal guys and I
think getting above that 65,000 level is
going to initiate a lot of conf
confidence for Bitcoin and will
ultimately just lead to a breakout into
new all-time highs as long as the S&P
500 can remain above its breakout zone
right the S&P currently trading at new
all-time highs and S&P all-time highs
always preedee Bitcoin all-time highs
there's never been a new Bitcoin
all-time high without the S&P first
having done that and so the S&P while it
could dip back down to retest the
previous all-time high before running
again that's POS possible you know
ultimately as long as we hold that
previous all-time high and then run
again Bitcoin is likely to give us a
nice result of this consolidation and if
Bitcoin does end up breaking out in that
way well the textbook suggest that from
your high to the lowest low of your
descending broadening wedge pattern
which is that low right there if you
extrapolate that and you put it on the
potential breakout Zone that lands you
at
102,000 I know sounds crazy sounds
ridiculous but that is is what the
textbook is telling us and you know what
it is a long-term pattern right this
wasn't just some two 3 4 week pennant
formation for the better part of 2024 we
were going sideways and down descending
broadening wedge this is a long-term
pattern and likely it was just an
accumulation zone for a lot of the
bigger players long-term accumulation
for almost a whole year if this breaks
out it's likely going to give us a a
substantial breakout now we're not going
to go up in a straight line that's not
what that line represents it could take
Bitcoin you know 6 months to actually
get to that
$102,000 textbook Target might just
trickle up for a few for half a year and
as you guys should know by now if you're
a viewer of this channel the thing that
supports the idea of a six Monon uptrend
is the fact that we've broken the weekly
RSI downtrend and every time we do that
there's at least six months to a year of
upside just go back in time this one led
to a year 2019 2020 broke out the RSI
one year up to
65,000 right go back in time look at
2018 six months up so these weekly RSI
breakouts are no joke and we just got
one so at least six months to the upside
descending broadening wedge Target
102,000 with a six-month time Target so
that's what we're looking for right now
hope you guys enjoyed this video if you
did Smash like subscribe and guys if you
haven't joined the patreon do so today
there are limited slots the prices will
go up but you can lock in these prices
now for a lifetime and there isn't
currently an annual discount we're doing
morning voice chats now in the Discord
so you can hop into a call with me just
about every morning of the week and ask
me whatever questions you want altcoin
picks trades Bitcoin whatever join the
patreon to get connected to the Discord
you can only join my Discord by becoming
a member of the patreon going to your
settings and conect connecting patreon
to Discord and you'll be loaded in so
take advantage of this now while it's
here and I'll see you guys in the next
video
Weitere ähnliche Videos ansehen
SOLANA UPDATE: $80 or $200 Next?
BITCOIN $2 BILLION SHORT SQUEEZE NOW!!!! Bitcoin News Today & Ethereum Price Prediction!
BITCOIN SOBE 12%, MAS CRUZ DA M0RT3 PODE DERRUBÁ-LO PRA 🤐
Macro Taking 'Wind' Out of Crypto: Starkiller's Drogen
Bitcoin (BTC): Get Ready for a New Trading Week! Bullish and Bearish Elliott Wave Analysis Scenarios
HUGE WARNING FOR BITCOIN TRADERS !!!
5.0 / 5 (0 votes)