Constant Velocity compared to Constant Acceleration

Timothy Palladino
28 Apr 201106:54

Summary

TLDRThis video explains the differences between constant velocity and uniform acceleration. Constant velocity means an object moves equal distances in equal amounts of time, resulting in a linear distance-time graph and zero acceleration. In contrast, uniform acceleration leads to increasing or decreasing distances over time, producing a quadratic distance-time graph and a linear velocity-time graph. The acceleration-time graph for constant velocity shows zero acceleration, while for uniform acceleration, it depicts a constant value. The video aims to clarify these key concepts graphically to resolve any lingering ambiguities.

Takeaways

  • 🚶 Constant velocity means that an object moves equal distances in equal amounts of time.
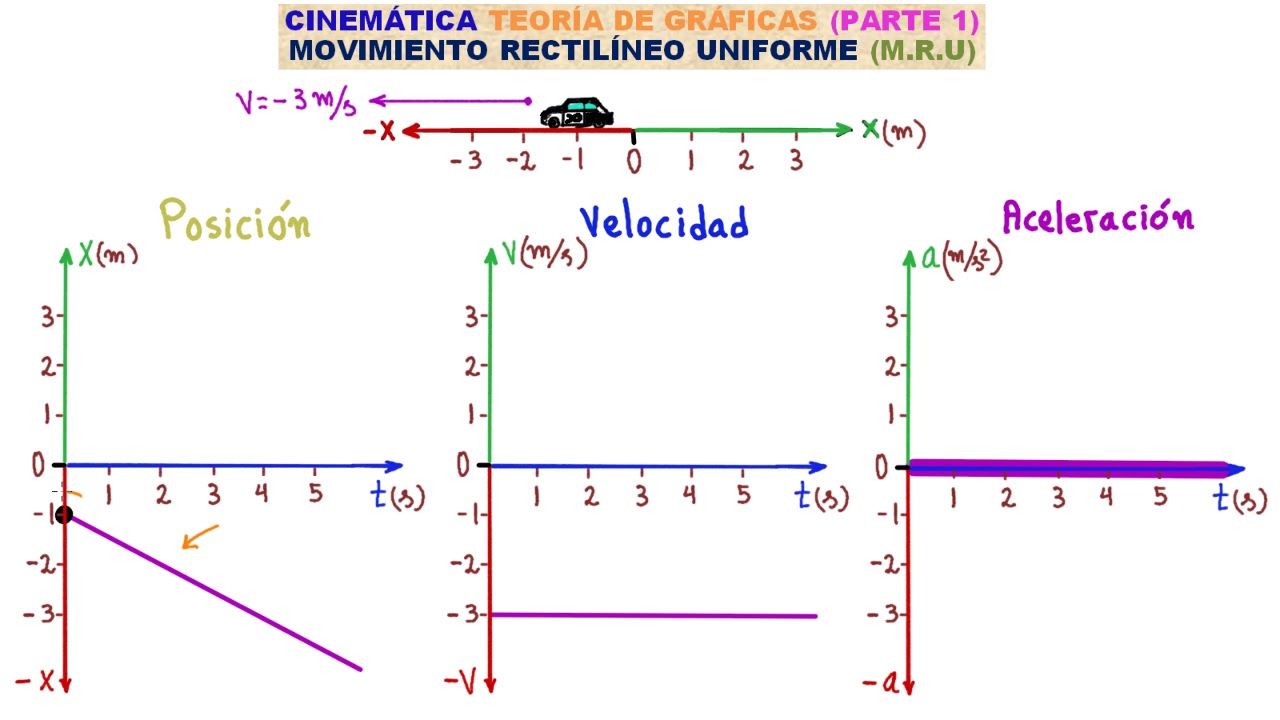
  • 📈 In a distance versus time graph for constant velocity, the relationship is linear, showing a straight line.
  • 🏃 Uniform acceleration (constant acceleration) means that the velocity of an object increases at a constant rate over time.
  • ⬆️ In a distance versus time graph for accelerating motion, the distance increases more significantly over time, creating a quadratic curve.
  • 📏 Displacement vectors for constant velocity are equal in length, while for accelerating objects, the vectors grow larger over time.
  • 🕑 For velocity versus time graphs, constant velocity is represented as a horizontal line, indicating no change in speed.
  • ⚖️ Constant acceleration results in a linear velocity versus time graph, showing that velocity increases steadily over time.
  • 0️⃣ Acceleration is zero for constant velocity, meaning there's no change in the object's speed over time.
  • 📉 For an object slowing down, displacement vectors in a distance versus time graph become shorter over time.
  • 💡 An acceleration versus time graph for constant acceleration shows a flat horizontal line, indicating a steady rate of acceleration.

Q & A

  • What are the two types of motion discussed in the transcript?

    -The two types of motion discussed are constant velocity and constant (or uniform) acceleration.

  • What does constant velocity mean?

    -Constant velocity means that an object moves with the same speed and direction over time, without any changes in velocity.

  • How does a distance vs. time graph look for an object with constant velocity?

    -For an object with constant velocity, the distance vs. time graph is a straight line, indicating a linear relationship where the object moves equal distances in equal amounts of time.

  • How is constant acceleration represented on a distance vs. time graph?

    -Constant acceleration is represented as a curve on a distance vs. time graph, indicating that the object moves increasingly farther distances over equal time intervals.

  • What is a key characteristic of an object moving with constant velocity?

    -A key characteristic is that the object moves equal distances in equal amounts of time, represented by displacement vectors of equal length on a distance vs. time graph.

  • What does the velocity vs. time graph look like for an object with constant velocity?

    -The velocity vs. time graph for an object with constant velocity is a straight, horizontal line, indicating that the velocity remains constant over time.

  • How does the acceleration vs. time graph appear for an object with constant velocity?

    -The acceleration vs. time graph for an object with constant velocity is a line along the time axis (zero acceleration), indicating that there is no change in velocity.

  • What does a velocity vs. time graph look like for an object with constant acceleration?

    -For an object with constant acceleration, the velocity vs. time graph is a straight, diagonal line, showing that velocity increases at a constant rate over time.

  • How is the acceleration vs. time graph represented for an object with constant acceleration?

    -The acceleration vs. time graph for constant acceleration is a horizontal line above the time axis, indicating that the acceleration remains constant over time.

  • What happens to the displacement vectors as time increases for an object with constant acceleration?

    -For an object with constant acceleration, the displacement vectors get progressively longer, indicating that the object moves greater distances in equal time intervals.

Outlines

00:00

📈 Understanding Constant Velocity and Constant Acceleration

In this section, the speaker distinguishes between two types of motion: constant velocity and constant (or uniform) acceleration. Constant velocity means the velocity of an object does not change, implying the object moves equal distances in equal time intervals. In contrast, uniform acceleration means the velocity changes at a constant rate, leading to increasing or decreasing distances traveled in equal time intervals. Graphical distinctions are introduced, with a focus on the distance-time graph for constant velocity (a linear relationship) versus that of constant acceleration (a quadratic curve). The description emphasizes how displacement vectors behave under both types of motion, with constant velocity resulting in equal displacement vectors, while acceleration leads to progressively larger displacement vectors, indicating the increasing distance covered.

05:03

🚗 Velocity-Time Graph and Acceleration Dynamics

This section covers the differences between constant velocity and acceleration using velocity-time and acceleration-time graphs. A velocity-time graph for constant velocity is depicted as a horizontal line, indicating no change in velocity over time, and therefore zero acceleration. The speaker emphasizes that constant velocity implies a zero acceleration value, as the velocity remains unchanged. In contrast, for accelerating objects, the velocity-time graph shows a linear increase, meaning the velocity changes at a constant rate. A brief discussion on acceleration-time graphs follows, where the speaker points out that for constant velocity, the acceleration remains at zero, while for constant acceleration, the acceleration-time graph is a horizontal line, illustrating that the acceleration does not vary.

Mindmap

Keywords

💡Constant velocity

Constant velocity refers to motion where an object's speed and direction remain unchanged over time. In the video, this is described as traveling equal distances in equal amounts of time. The distance versus time graph for constant velocity is linear, indicating no change in speed or direction.

💡Uniform acceleration

Uniform acceleration occurs when an object’s velocity increases or decreases at a constant rate. The video emphasizes that in this type of motion, the velocity changes uniformly over time, as shown in the velocity versus time graph where the line is straight, indicating a steady increase or decrease in speed.

💡Distance versus time graph

This graph represents how the distance traveled by an object changes over time. For constant velocity, the graph is linear, while for accelerated motion, the graph is quadratic, indicating that the object travels increasing distances in equal time intervals as it accelerates.

💡Displacement vector

A displacement vector shows the change in position of an object over a specific time interval. In the video, for constant velocity, these vectors are equal in length, while for accelerated motion, the vectors grow larger as the object's speed increases, representing more distance covered over time.

💡Velocity versus time graph

This graph depicts how an object’s velocity changes with time. In the video, for constant velocity, the graph is a straight horizontal line, indicating no change in speed. For uniform acceleration, the graph shows a linear increase, meaning the object's velocity rises at a steady rate.

💡Acceleration versus time graph

This graph illustrates how an object's acceleration changes over time. In the video, for constant velocity, the acceleration graph is flat along the time axis, indicating zero acceleration. For constant acceleration, the graph is a straight horizontal line above the time axis, showing that acceleration remains constant.

💡Linear relationship

A linear relationship indicates that two quantities change at a constant rate relative to each other. In the context of the video, the distance versus time graph for constant velocity is linear, meaning distance increases uniformly with time, while the velocity versus time graph for uniform acceleration is also linear.

💡Quadratic relationship

A quadratic relationship means one quantity changes at a rate proportional to the square of another. In the video, the distance versus time graph for accelerated motion is quadratic, showing that the object covers more distance in each successive time interval as its speed increases.

💡Equal distances in equal times

This phrase describes the characteristic of constant velocity, where an object travels the same distance in each equal time interval. The video illustrates this by showing how, for an object moving with constant velocity, the displacement vectors on the distance versus time graph are the same length.

💡Zero acceleration

Zero acceleration means that an object's velocity is not changing over time. In the video, for constant velocity motion, the acceleration versus time graph is flat along the time axis, representing no change in velocity, thus no acceleration.

Highlights

The two types of motion discussed are constant velocity and constant (or uniform) acceleration.

For constant velocity motion, the velocity remains unchanged, meaning the object travels equal distances in equal intervals of time.

The distance vs. time graph for constant velocity motion is a linear relationship, where displacement vectors are of equal length at each time interval.

In contrast, for objects with constant acceleration, the distance traveled increases over time, creating a quadratic relationship on the distance vs. time graph.

For constant acceleration, the displacement vectors grow larger with each time interval, indicating the object is moving faster as time progresses.

When an object is slowing down (negative acceleration), the displacement vectors would decrease in size over time.

In a velocity vs. time graph for constant velocity, the line is horizontal, showing no change in velocity over time, meaning the acceleration is zero.

The velocity vs. time graph for constant acceleration is a linear upward-sloping line, indicating that the velocity is increasing at a constant rate.

The slope of the velocity vs. time graph in constant acceleration represents a uniform increase in velocity over equal time intervals.

For constant velocity motion, the acceleration vs. time graph is a flat line at zero, showing that there is no acceleration.

For constant acceleration motion, the acceleration vs. time graph is a straight horizontal line above zero, indicating constant acceleration.

The graphical representation helps to clarify that in constant velocity motion, no velocity change occurs, while in constant acceleration, the velocity changes steadily.

In a case where acceleration changes (non-uniform acceleration), the acceleration vs. time graph would no longer be a horizontal line.

The length of the displacement vectors in a distance vs. time graph provides a visual representation of how far an object travels within specific time intervals.

Constant acceleration results in increasing velocity, where each subsequent velocity vector is longer than the previous, indicating a faster-moving object over time.

Transcripts

play00:00

in the last few sessions we

play00:01

distinguished the two different types of

play00:03

motion one type of motion we called

play00:05

constant

play00:06

velocity and that me that the velocity

play00:09

does not change what it means for an

play00:11

object to travel with constant velocity

play00:13

now the other type of motion we talked

play00:15

about was constant sometimes called

play00:17

uniform acceleration and what I'd like

play00:20

to do in this video is to look at the

play00:22

graphical distinctions between the two

play00:25

um distinct type of motions that way we

play00:27

can kind of clarify any ambiguity that's

play00:30

Still

play00:31

Remains so if I were to look at the in

play00:33

this first case distance versus time

play00:36

graph and I'll write it as D of T to

play00:39

indicate that it is a um distance is a

play00:42

function of Time Versus time for each

play00:44

one of these case and this could be

play00:46

distance in the X direction or it could

play00:48

be distance in the y direction and

play00:50

versus time I want to take a first look

play00:54

at this distinction so for an object

play00:56

moving with constant velocity what's

play00:58

what you should see if increase at a

play01:00

constant rate so if this is my time

play01:03

equals 1 second 2 seconds and 3 seconds

play01:07

now what you should see is as you go up

play01:09

from the time axis and intersect with

play01:12

the distance versus time curve and go

play01:14

over to the distance axis you'll be

play01:16

moving equal distances in equal amounts

play01:19

of time that's one of the ways you can

play01:21

distinguish constant velocity motion you

play01:23

move equal distances in equal amounts of

play01:26

time now depending on how accurately I

play01:29

do this but what you should see is that

play01:31

the displacement Vector the vector that

play01:33

indicates how far you move in a specific

play01:35

instance of time should all be the same

play01:38

length for an object traveling at

play01:41

constant velocity and kind of Drew it

play01:42

relatively accurately there you can kind

play01:45

of see that all of these vectors are

play01:47

about the same length and the only

play01:49

limitation is how accurately I can

play01:50

actually represent them now one last

play01:53

thing we call this a nice linear

play01:55

relationship all right that meant that

play01:57

the velocity increases at a constant

play02:00

rate or the distance traveled each

play02:02

interval of time is going to be constant

play02:05

you travel equal distances in equal

play02:06

amounts of time now for an object that's

play02:09

accelerating there was this nice

play02:10

quadratic relationship and what that was

play02:13

indicating is during each say 1 second

play02:15

interval of time in this particular case

play02:18

you will be moving increasingly farther

play02:20

away from The Observer now that's for

play02:22

this one particular case but there are

play02:24

cases in which the distance traveled

play02:27

each instance of time is decreasing

play02:29

because the velocity is also decreasing

play02:32

but I didn't draw that one for this one

play02:35

now if I go up from the time axis

play02:36

intersect with the distance versus time

play02:38

curve and then over to the distance axis

play02:40

what you should see is that the

play02:43

displacement Vector will get farther and

play02:45

farther and farther or larger and larger

play02:47

and larger and that's going to just

play02:49

indicate that the distance traveled each

play02:51

interval of time for an object that's

play02:54

accelerating is getting greater and

play02:57

greater and greater and in this case is

play02:59

worked out very nicely you can see that

play03:01

with each instance of time the

play03:03

displacement Vector is getting larger

play03:06

and larger and larger now for an object

play03:09

that's slowing down what you would see

play03:10

is that these displacement get vectors

play03:12

get smaller and smaller and smaller now

play03:15

if we were to look at a velocity versus

play03:17

time graph for each of these two

play03:19

distinct types of motion which I'll

play03:20

write as V of T to indicate the velocity

play03:24

is a function of time in time on this

play03:27

axis again for both of these for an

play03:30

object that's traveling with constant

play03:31

velocity what you'll see is that my

play03:34

velocity line will be a nice straight

play03:37

horizontal line so like let's say this

play03:39

is our initial time and this is our

play03:42

final time and I go up from the time

play03:45

axis to the velocity versus time curve

play03:47

what you should

play03:49

see is that if this is my initial

play03:52

velocity given by my initial time and

play03:53

this is my final time and this is my

play03:57

final velocity that the velocity between

play03:59

the two points is the same now what that

play04:02

indicates is if these two velocities are

play04:05

the same the change in velocity per

play04:07

change in time and it doesn't matter the

play04:10

time that it takes to change its

play04:11

velocity because the velocity change is

play04:13

zero will be 0 m per second squared all

play04:18

right and what that's going to tell us

play04:20

is that the acceleration is zero the

play04:22

change in velocity per change in time is

play04:23

zero the velocity Remains the Same and

play04:26

so the acceleration is zero so at any

play04:29

point in time this velocity will be the

play04:32

same now if I look at a velocity versus

play04:36

time graph for an object that's

play04:37

accelerating I'll see a nice linear

play04:39

relationship and that means that the

play04:42

velocity changes at a constant rate so

play04:46

if this is 1 second of time 2 seconds of

play04:49

time 3 seconds of time if I go up from

play04:52

the time axis intersect with the

play04:54

velocity versus time curve and go over

play04:56

to the velocity axis and it what I

play04:59

should see is that I'm my velocity

play05:02

vectors would be the same in each case

play05:05

because my velocity is increasing at a

play05:07

constant rate so depending on how

play05:10

accurately I drew this one this velocity

play05:13

Vector should be the same lengths in all

play05:15

three cases and it relatively is given

play05:18

my limited artistic abilities but this

play05:20

is a nice linear relationship for a

play05:23

velocity versus time graph per something

play05:24

the velocity is increasing at the exact

play05:26

same rate during each interval of time

play05:29

and now let's just clear up some room on

play05:31

the workspace and take a look at what it

play05:33

means for an object to be accelerating

play05:36

during this period of time so if I draw

play05:37

an acceleration versus time graph for

play05:40

each of these distinct types of

play05:43

motion what I should see for an object

play05:45

that's traveling with constant velocity

play05:48

any object traveling with constant

play05:49

velocity The Velo the acceleration

play05:51

versus time graph will be right along

play05:53

the time access because at any single

play05:56

Moment In Time the acceleration will be

play05:59

zero so acceleration equals 0 m/s the

play06:03

Velocity in this case is not changing so

play06:06

the velocity Remains the Same because

play06:08

it's not accelerating now if I were to

play06:10

look at an acceleration versus time

play06:12

graph for an object traveling with I Dre

play06:14

it in this particular Cas is I would

play06:15

have a nice straight horizontal line so

play06:18

that any moment in time say this is my T

play06:20

initial and this is my T final I should

play06:23

when I go up from my time axis

play06:30

what I should see is that at any point

play06:32

in time my acceleration is the same so

play06:34

in this case my acceleration is constant

play06:37

all right my acceleration doesn't change

play06:39

that what it that's what it means by

play06:41

constant acceleration now there there

play06:43

are types of motion in which the

play06:45

acceleration does change but those are

play06:47

not the type of motions that we will be

play06:48

analyzing during this uh course

Rate This

5.0 / 5 (0 votes)

Ähnliche Tags
PhysicsMotionVelocityAccelerationGraphsConstant SpeedLearningEducationScienceConcepts
Benötigen Sie eine Zusammenfassung auf Englisch?