Google Data Studio Tutorial 📊 - How to build a Dashboard with GDS
Summary
TLDRThis video tutorial offers an insightful overview of Google Data Studio, highlighting its capabilities to connect with various data sources and create interactive, visually appealing reports. The guide walks viewers through the process of building an e-commerce dashboard, adding scorecards, maps, and charts, and enabling interactivity with filters. It concludes with sharing options, emphasizing the tool's ease of use and effectiveness in dashboard creation.
Takeaways
- 🚀 Google Data Studio is a powerful and free tool for creating data visualizations and reports.
- 🔗 It connects to various data sources such as Google Analytics, Google Ads, Facebook Ads, and Google Sheets.
- 🎨 The tool allows for the creation of interactive and customizable dashboards for clients and stakeholders.
- 📊 Key features include scorecards for KPIs, maps, time series charts, and pie charts for data representation.
- 🛠️ Users can adjust and style elements like borders, corner radii, and padding for a polished report look.
- 📅 Date range comparison and filters add interactivity, allowing users to view data for specific time periods or segments.
- 🌍 Map visualizations can be customized to represent different metrics, such as revenue by country.
- 📈 Time series charts can display trends for multiple metrics, with options to show revenue over time.
- 🔄 Duplicate and modify elements quickly to create consistent styling across the report.
- 🔗 Sharing options include downloading as PDF, automatic email delivery, and sharing via Google Drive.
- 📝 The script provides a comprehensive guide to building an e-commerce report in about 15 minutes.
Q & A
What is Google Data Studio?
-Google Data Studio is a free tool from Google that allows users to connect to various data sources and create visual reports for sharing with clients, stakeholders, and team members.
How has Google Data Studio evolved over time?
-Google Data Studio has significantly improved over the last few months and years, with enhanced features and capabilities, making it a more powerful and user-friendly tool for data visualization and reporting.
What are some of the data sources that Google Data Studio can connect to?
-Google Data Studio can connect to a wide range of data sources including Google Analytics, Google Ads, Facebook Ads, Google Sheets, and Google BigQuery, among others.
What is the first step in creating a report with Google Data Studio?
-The first step in creating a report with Google Data Studio is to connect the report to a data source by clicking on 'Create new data source'.
How can you add a header and title to your report in Google Data Studio?
-To add a header and title, you start by creating a rectangle, resizing it, changing its color, and then adding the title text. You can modify the text's color, font size, and resize or move the widget to position it effectively.
What are scorecards in Google Data Studio and how are they used?
-Scorecards in Google Data Studio are used to display key performance indicators (KPIs) or any numerical data. They can be styled and configured to show metrics such as transactions, revenue, or other important business numbers.
How can you add interactivity to a Google Data Studio report?
-Interactivity can be added to a report by including features like date control filters, drop-down menus for filtering by source medium, device category, and user type, allowing the end user to customize the data view based on their needs.
What are the different types of visualizations available in Google Data Studio?
-Google Data Studio offers various visualizations including scorecards, maps, time series charts, pie charts, and bar charts, which can be customized and arranged to create comprehensive and interactive reports.
How can you share a Google Data Studio report with others?
-Reports can be shared by downloading them as a PDF, setting up automatic email delivery, creating a shareable link, or sharing them like any other Google Drive document with specific emails or through a published link.
What is the purpose of the sample data provided by Google in Google Data Studio?
-The sample data provided by Google is intended to help new users familiarize themselves with the tool and its capabilities without having to connect to real data sources initially.
How long does it typically take to create a functional report in Google Data Studio?
-According to the script, it is possible to create a beautiful, interactive, and fully functional report in about 15 minutes, although the actual time may vary depending on the complexity of the report and the user's familiarity with the tool.
Outlines

Dieser Bereich ist nur für Premium-Benutzer verfügbar. Bitte führen Sie ein Upgrade durch, um auf diesen Abschnitt zuzugreifen.
Upgrade durchführenMindmap

Dieser Bereich ist nur für Premium-Benutzer verfügbar. Bitte führen Sie ein Upgrade durch, um auf diesen Abschnitt zuzugreifen.
Upgrade durchführenKeywords

Dieser Bereich ist nur für Premium-Benutzer verfügbar. Bitte führen Sie ein Upgrade durch, um auf diesen Abschnitt zuzugreifen.
Upgrade durchführenHighlights

Dieser Bereich ist nur für Premium-Benutzer verfügbar. Bitte führen Sie ein Upgrade durch, um auf diesen Abschnitt zuzugreifen.
Upgrade durchführenTranscripts

Dieser Bereich ist nur für Premium-Benutzer verfügbar. Bitte führen Sie ein Upgrade durch, um auf diesen Abschnitt zuzugreifen.
Upgrade durchführenWeitere ähnliche Videos ansehen

Dream Report by Ocean Data Systems

Introduction to Power BI: What is it?
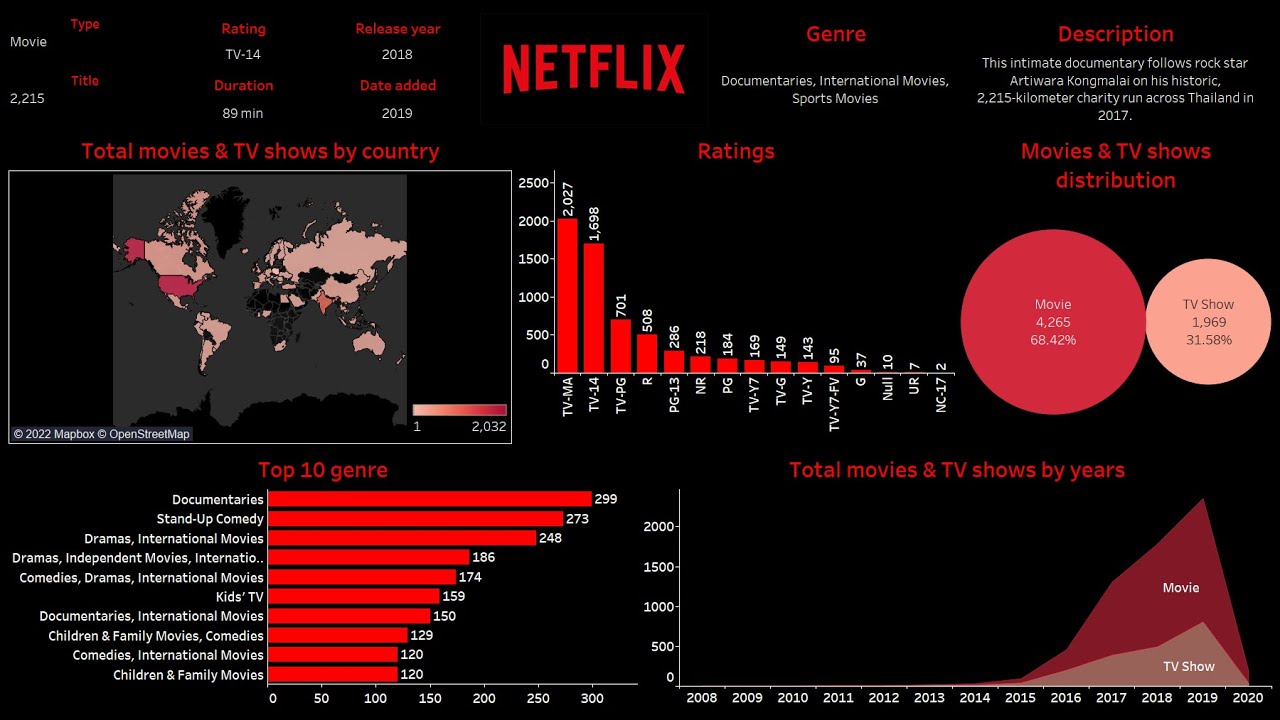
Create Netflix dashboard with Tableau in 30 minutes

Learn Excel Pivot Tables in 10 Minutes - A complete beginner's tutorial
Tableau Dashboard Tutorial dalam 12 Menit | Bahasa Indonesia
Membuat Dashboard di Google Sheet | Belajar Fungsi Query | Indonesia
5.0 / 5 (0 votes)
