Phase Diagrams and the States of Matter
Summary
TLDRThe video script explores phase diagrams, illustrating how substances' physical states change with temperature and pressure variations. It highlights three phases: solid, liquid, and gas, each with distinct molecular arrangements and behaviors. The script explains equilibrium conditions along phase boundaries, such as melting, freezing, vaporizing, and condensing. It also discusses critical points where phase distinctions vanish and the triple point where all three phases coexist in equilibrium.
Takeaways
- 📊 A phase diagram illustrates the stable states of a substance at different temperatures and pressures.
- 🔍 Each region in the diagram represents a phase where the substance is stable under specific conditions.
- ➡️ The lines on the diagram indicate the conditions at which two phases are in equilibrium.
- ❄️ Lower temperatures and higher pressures typically correspond to the solid phase.
- 💧 Higher temperatures and pressures are associated with the liquid phase.
- 🌬️ Lower pressures and higher temperatures are characteristic of the gas phase.
- 🔬 In the solid phase, particles are closely packed in a regular array and vibrate around fixed points.
- 🌊 In the liquid phase, particles are less restricted and move more freely, allowing them to roll and tumble.
- 🌀 In the gas phase, particles are widely spaced and only come close during collisions.
- 🔄 At any point on the phase boundary lines, the rates of phase transitions are equal (e.g., melting and freezing in solid-liquid equilibrium).
- 🌀 The critical point on the liquid-gas line is where the distinction between liquid and gas phases disappears due to equal densities.
- 🔱 The triple point is where the three phases (solid, liquid, gas) coexist in equilibrium.
Q & A
What does a phase diagram specify?
-A phase diagram specifies the physical state of a substance as temperature and pressure vary.
What do the regions and lines on a phase diagram represent?
-The regions on a phase diagram display the conditions at which a particular phase is stable, while the lines between regions show the conditions at which two phases are in equilibrium.
What is the general relationship between temperature, pressure, and phase in most substances?
-In general, lower temperatures and higher pressures correspond to the solid phase, higher pressures and temperatures correspond to the liquid phase, and lower pressures and higher temperatures correspond to the gas phase.
How do particles behave in the solid phase according to the molecular view?
-In the solid phase, particles are tightly packed in a regular array, typical of a crystalline solid, and they jiggle in place around their crystal sites.
What is the main difference between the particles in the solid and liquid phases?
-In the liquid phase, particles are still in close contact but are less restricted in movement compared to the solid phase, allowing them to roll and tumble around one another.
How do particles behave in the gas phase compared to the solid and liquid phases?
-In the gas phase, particles are far apart except when they collide, which is in stark contrast to the close proximity of particles in the solid and liquid phases.
What happens along the solid-liquid line on a phase diagram?
-Along the solid-liquid line, the solid and liquid phases are in equilibrium, meaning melting and freezing occur at the same rate.
What does the critical point on a phase diagram represent?
-The critical point is the end of the liquid-gas line, beyond which the distinction between liquid and gas phases disappears because their densities become equal.
What occurs at the triple point on a phase diagram?
-At the triple point, all three phases (solid, liquid, and gas) are in equilibrium simultaneously.
How do particles behave as they approach the critical point on the phase diagram?
-As particles approach the critical point, gas particles move closer, increasing density, while liquid particles separate more, decreasing density, until their densities become equal and phase separation disappears.
Outlines

Dieser Bereich ist nur für Premium-Benutzer verfügbar. Bitte führen Sie ein Upgrade durch, um auf diesen Abschnitt zuzugreifen.
Upgrade durchführenMindmap

Dieser Bereich ist nur für Premium-Benutzer verfügbar. Bitte führen Sie ein Upgrade durch, um auf diesen Abschnitt zuzugreifen.
Upgrade durchführenKeywords

Dieser Bereich ist nur für Premium-Benutzer verfügbar. Bitte führen Sie ein Upgrade durch, um auf diesen Abschnitt zuzugreifen.
Upgrade durchführenHighlights

Dieser Bereich ist nur für Premium-Benutzer verfügbar. Bitte führen Sie ein Upgrade durch, um auf diesen Abschnitt zuzugreifen.
Upgrade durchführenTranscripts

Dieser Bereich ist nur für Premium-Benutzer verfügbar. Bitte führen Sie ein Upgrade durch, um auf diesen Abschnitt zuzugreifen.
Upgrade durchführenWeitere ähnliche Videos ansehen

Phase diagrams | States of matter and intermolecular forces | Chemistry | Khan Academy
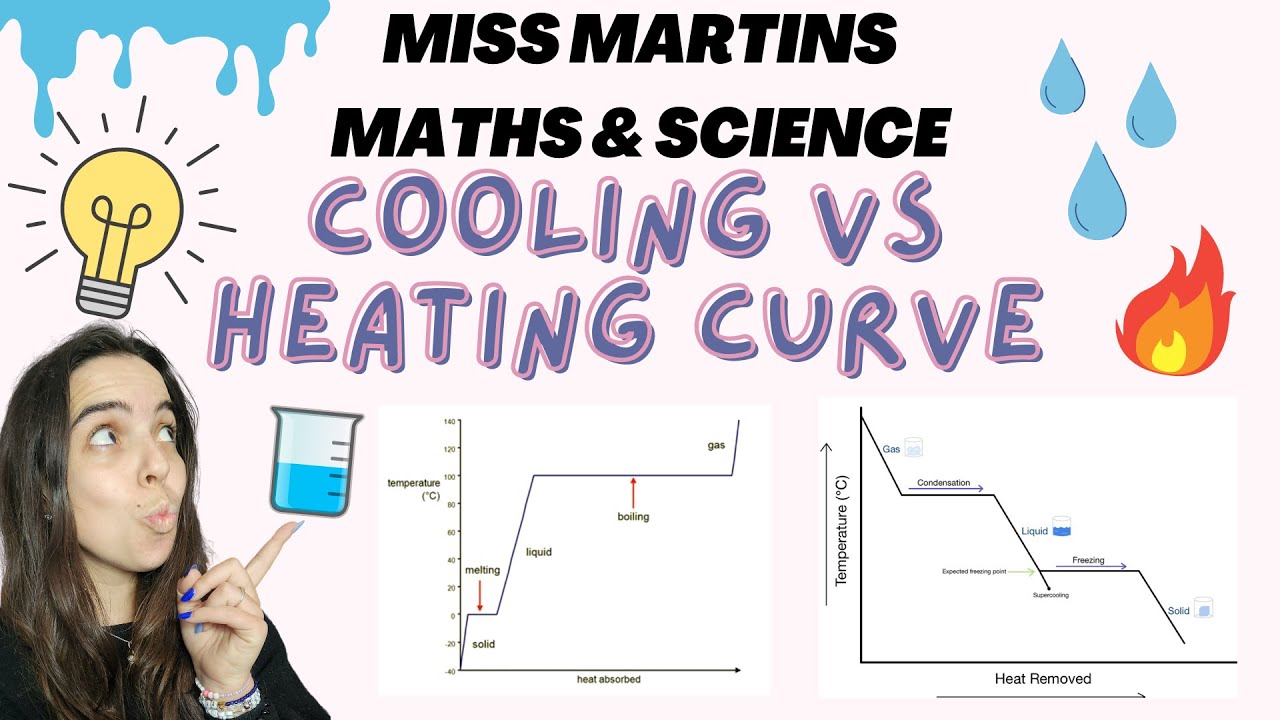
Cooling curve vs Heating curve Grade 10 Chemistry

Phase Diagrams | Phase Diagram of Water and Phase Diagram of Carbon Dioxide

T-v Diagrams and PROPERTY TABLES for Thermodynamics in 13 Minutes!
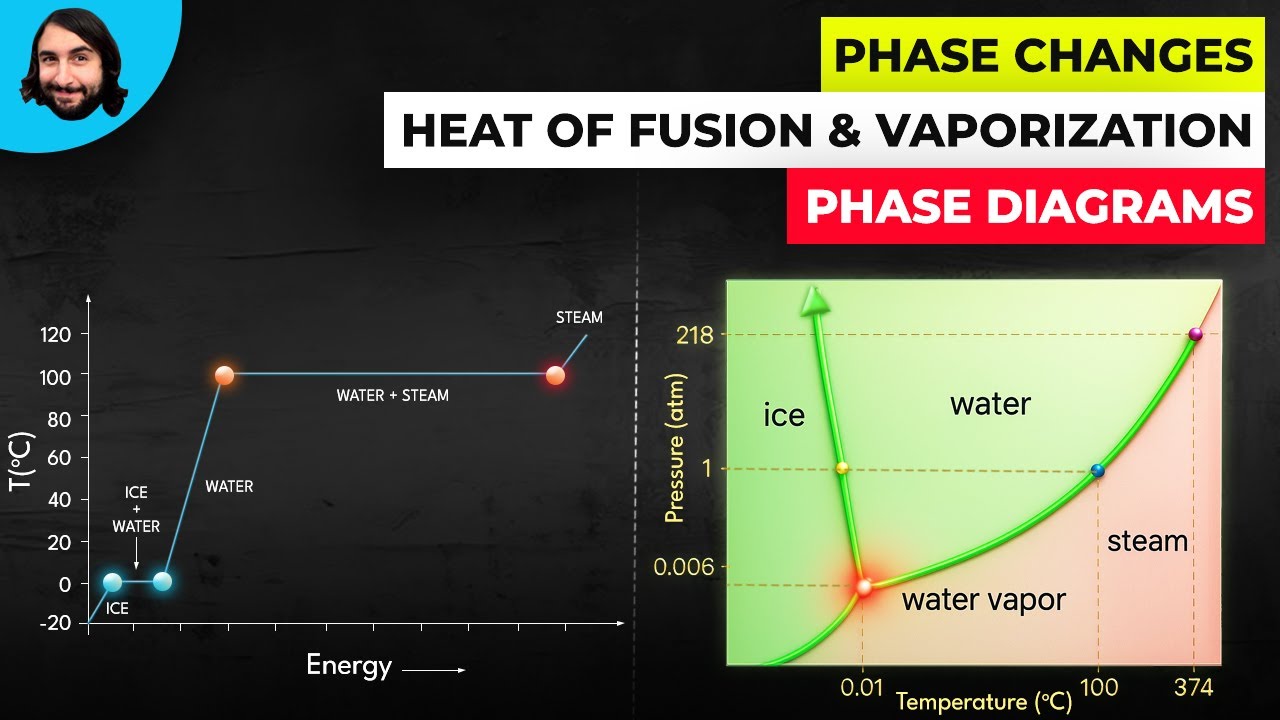
Phase Changes, Heats of Fusion and Vaporization, and Phase Diagrams

10.4 Changes of State (1/2)
5.0 / 5 (0 votes)
