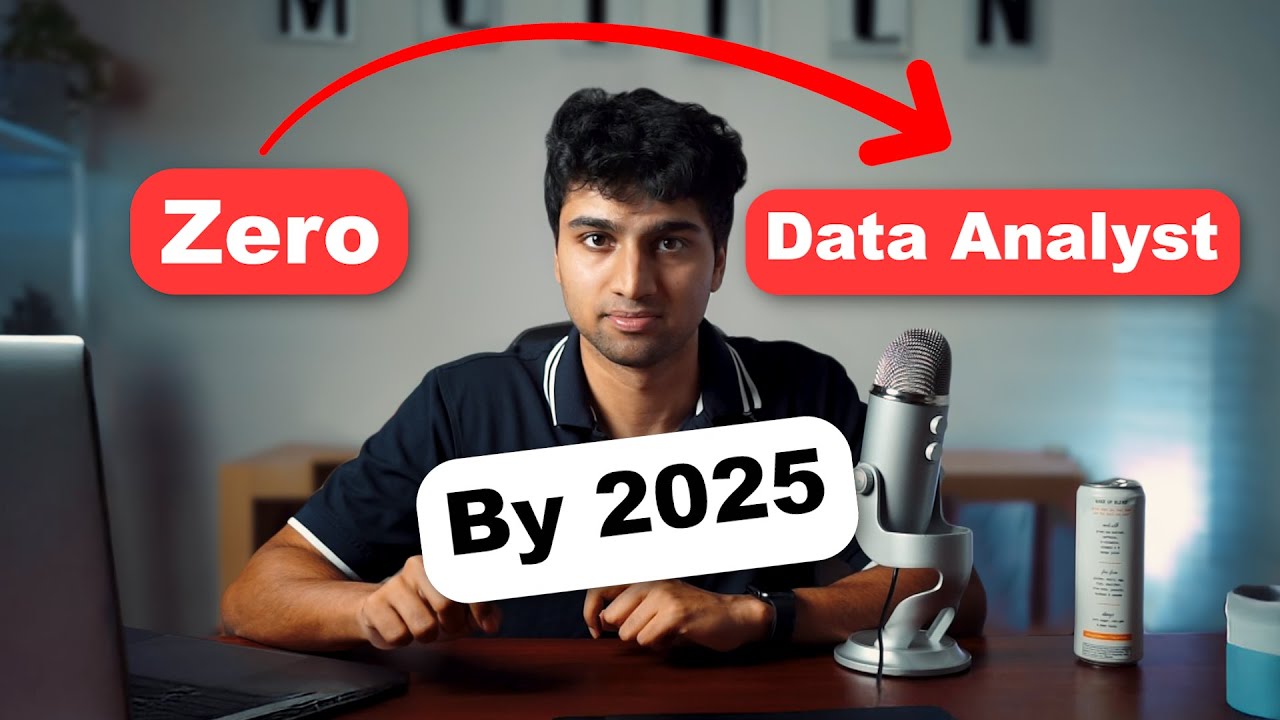
ROADMAP to becoming a Data Analyst in 2024
Summary
TLDRIn this video, Sandep shares a cost-effective roadmap for aspiring data analysts in 2024, emphasizing that a traditional master's degree and significant investment are no longer prerequisites. He suggests starting with mastering Excel, followed by SQL, Python, and data visualization tools like Tableau or Power BI. Sandep also stresses the importance of understanding basic math and statistics. He recommends building projects to solidify learning and showcase skills, and encourages communication of these projects to simulate real-world data analyst roles.
Takeaways
- 🎓 Becoming a data analyst in 2024 doesn't require a significant financial investment; resources like YouTube and ChatGPT can facilitate learning.
- 📈 Data analysis is a valuable skill across various sectors including healthcare, finance, retail, technology, and sports, indicating a consistent demand.
- 💼 The top skills required for data analysts are SQL, Excel, Python, Tableau, and Power BI, as identified from job postings.
- 📊 Excel is crucial for data analysts as it's commonly used by business teams and stakeholders for discussing data and insights.
- 🗝️ SQL is fundamental for data analysts, as it's the language used to communicate with databases, and is present in nearly all job postings.
- 🐍 Python is not mandatory but is highly beneficial for automating tasks, data cleaning, and setting up pipelines in data analysis.
- 📊 Data visualization skills are important for presenting analysis and insights to stakeholders, with Tableau and Power BI being popular tools.
- 📊 Understanding data visualization concepts is essential before mastering specific tools, as it guides the choice of appropriate charts and graphs.
- 🧮 A solid grasp of basic math and statistics is necessary for data analysts to perform effective data analysis.
- 🔨 Building projects is an effective way to learn and showcase data analysis skills, starting with personal life projects and then moving to real-world datasets.
- 📢 Communication of data analysis findings is crucial, which can be done through written formats like LinkedIn posts or videos on platforms like YouTube.
Q & A
What is the main message of the video regarding becoming a data analyst in 2024?
-The main message is that becoming a data analyst in 2024 is feasible with minimal investment, primarily through learning resources available on platforms like YouTube and ChatGPT.
What are the top five skills identified in the video as essential for a data analyst?
-The top five skills are SQL, Excel, Python, Tableau, and Power BI.
Why does the speaker emphasize the importance of Excel for data analysts?
-Excel is emphasized because it is a basic spreadsheet tool that is commonly used by business teams and stakeholders for discussing numbers, trends, and patterns, making it a go-to tool for sharing analysis and findings.
What is the significance of SQL in the role of a data analyst according to the video?
-SQL is significant because it is the language used to communicate with databases, data warehouses, or data lakes, and is essential for performing data analysis tasks such as building reports or dashboards.
Why is Python recommended as a programming language for data analysts?
-Python is recommended because it is powerful and used for tasks like data automation, cleaning, transformation, and setting up pipelines, which are important for advancing data analysis skills.
What are the two advantages of building projects as mentioned in the video?
-The two advantages are active learning through application of concepts and showcasing skills on platforms like resumes, LinkedIn profiles, or portfolio websites.
How does the speaker suggest one should start with project ideas for data analysis?
-The speaker suggests starting with personal life projects, such as analyzing personal expenses, and then moving on to real-world datasets from sources like Kaggle and Google datasets.
What is the speaker's recommendation for the learning path to become a data analyst?
-The recommended learning path is Excel, SQL, Python, and then either Tableau or Power BI.
Why is basic math and statistics important for data analysts, as per the video?
-Basic math and statistics are important because they form the foundation for understanding and applying concepts like averages, median, standard deviation, percentage difference, and probabilities during data analysis.
What does the speaker suggest as a method to enhance the learning experience in data analysis?
-The speaker suggests using real-world data sets that are of personal interest, such as sports or finance data, to make the learning process more enjoyable and easier.
How does the speaker propose to communicate the results of data analysis projects?
-The speaker proposes communicating the results through written formats like LinkedIn posts or Medium articles, or spoken formats like YouTube videos, to simulate a real-world data analyst role.
Outlines

Dieser Bereich ist nur für Premium-Benutzer verfügbar. Bitte führen Sie ein Upgrade durch, um auf diesen Abschnitt zuzugreifen.
Upgrade durchführenMindmap

Dieser Bereich ist nur für Premium-Benutzer verfügbar. Bitte führen Sie ein Upgrade durch, um auf diesen Abschnitt zuzugreifen.
Upgrade durchführenKeywords

Dieser Bereich ist nur für Premium-Benutzer verfügbar. Bitte führen Sie ein Upgrade durch, um auf diesen Abschnitt zuzugreifen.
Upgrade durchführenHighlights

Dieser Bereich ist nur für Premium-Benutzer verfügbar. Bitte führen Sie ein Upgrade durch, um auf diesen Abschnitt zuzugreifen.
Upgrade durchführenTranscripts

Dieser Bereich ist nur für Premium-Benutzer verfügbar. Bitte führen Sie ein Upgrade durch, um auf diesen Abschnitt zuzugreifen.
Upgrade durchführenWeitere ähnliche Videos ansehen

Top 5 Best Master's Degrees (2024)

Is The Google Data Analytics Certification Worth It? || FULL review

How I would learn Data Analysis (If i could start over) | Data Analyst Roadmap 2024

Complete Roadmap To Become Data Analyst In 2024 With Videos And Materials

Kenyataan Pahit menjadi seorang Data Analyst

How to become a Data Analyst FAST (By 2025)
5.0 / 5 (0 votes)
