ICT Mentorship Core Content - Month 07 - Short Term Trading Defining Weekly Range Profiles
Summary
TLDRThis lesson breaks down weekly market-profile patterns and how institutional ‘manipulation’ often shapes price behavior. It explains classic profiles — Tuesday low/high, Wednesday low/high, consolidation Thursday reversals, midweek rallies/declines, Friday “seek-and-destroy” moves, and Wednesday weekly reversals — and shows how to anticipate them by referencing higher-timeframe premium/discount arrays. Key cues include price hovering relative to those arrays, London and New York session drives, and reactions around rate or news events (FOMC, NFP). The instructor urges hands-on study with one-hour charts and PD arrays to recognize recurring precursors and strengthens this with upcoming market-maker templates.
Takeaways
- 😀 Understanding the weekly range profiles is essential for short-term trading. These profiles provide key insights into market behavior and trends.
- 😀 The 'classic Tuesday low of the week' involves manipulation where price hovers above a discount array on Monday, drops into it on Tuesday, and forms the weekly low.
- 😀 Conversely, the 'classic Tuesday high of the week' sees price hovering below a premium array on Monday, rising into it on Tuesday to form the weekly high.
- 😀 The 'Wednesday low of the week' follows a pattern of price consolidation earlier in the week, with a drop into a higher time frame discount array to form the low.
- 😀 The 'Wednesday high of the week' operates similarly to the Tuesday high, where price consolidates below a premium array and rises into it on Wednesday to form the high.
- 😀 'Consolidation Thursday reversal' occurs when price consolidates Monday through Wednesday, runs the entry week low, and reverses into a bullish trend by Thursday.
- 😀 For a bearish 'consolidation Thursday reversal,' price consolidates through Monday-Wednesday, runs the entry week high, and reverses lower into Friday.
- 😀 The 'consolidation midweek rally' profile is bullish, where price consolidates before breaking the intra-week high and expanding higher toward Friday.
- 😀 The 'consolidation midweek decline' profile is bearish, with price consolidating before breaking the intra-week low and declining into Friday.
- 😀 'Seek and Destroy' Friday profiles occur when price consolidates Monday-Thursday and runs shallow stops before expanding in either direction. This is a low-probability market condition, especially around high-impact news events like rate announcements.
Q & A
What is the main focus of Lesson Two in the March 2017 ICT Mentorship content?
-Lesson Two focuses on defining the weekly range profiles in short-term trading, helping traders identify how weekly highs and lows typically form and how to anticipate them.
What is meant by the 'classic Tuesday low of the week' profile?
-This profile occurs in a generally bullish market where price manipulates traders by dropping into a higher timeframe discount array on Tuesday, forming the low of the week before moving higher.
How can traders anticipate the 'classic Tuesday low of the week' scenario?
-Traders can anticipate it by identifying higher timeframe discount arrays and observing when price fails to drop into these areas on Monday, suggesting a potential drive lower during Tuesday’s London or New York session.
What characterizes the 'classic Tuesday high of the week' profile?
-This occurs in a generally bearish market where price hovers below a premium array on Monday, then rises into that premium area on Tuesday to form the high of the week before declining.
What is the main concept behind the 'Wednesday low of the week' profile?
-In a bullish market, if price hovers above discount arrays on Monday and Tuesday, it may drop into them on Wednesday to form the weekly low, typically around the London or New York sessions.
What defines a 'consolidation Thursday reversal' in a bullish market?
-This pattern shows consolidation from Monday through Wednesday, followed by a run below the intraweek low and a reversal higher on Thursday, often triggered by major news or rate announcements around 2 PM New York time.
How does the bearish version of the 'consolidation Thursday reversal' differ?
-In the bearish version, price consolidates early in the week, then runs above the intraweek high on Thursday and reverses downward, typically following a key news event or economic release.
What is the 'consolidation midweek rally' and when does it occur?
-This is a bullish market profile where price consolidates from Monday to Wednesday, runs the intraweek high, and then expands higher into Friday. It occurs when the market has recently rallied from a discount array and is targeting a higher premium array.
What are 'Seek and Destroy' profiles and why are they considered low-probability setups?
-Seek and Destroy profiles occur when the market consolidates from Monday through Thursday, running shallow stops both above and below intraweek highs and lows before expanding on Friday. They are low-probability setups often associated with uncertain or news-driven markets, such as during interest rate announcements or non-farm payroll weeks.
What is the 'Wednesday weekly reversal' pattern and what does it indicate?
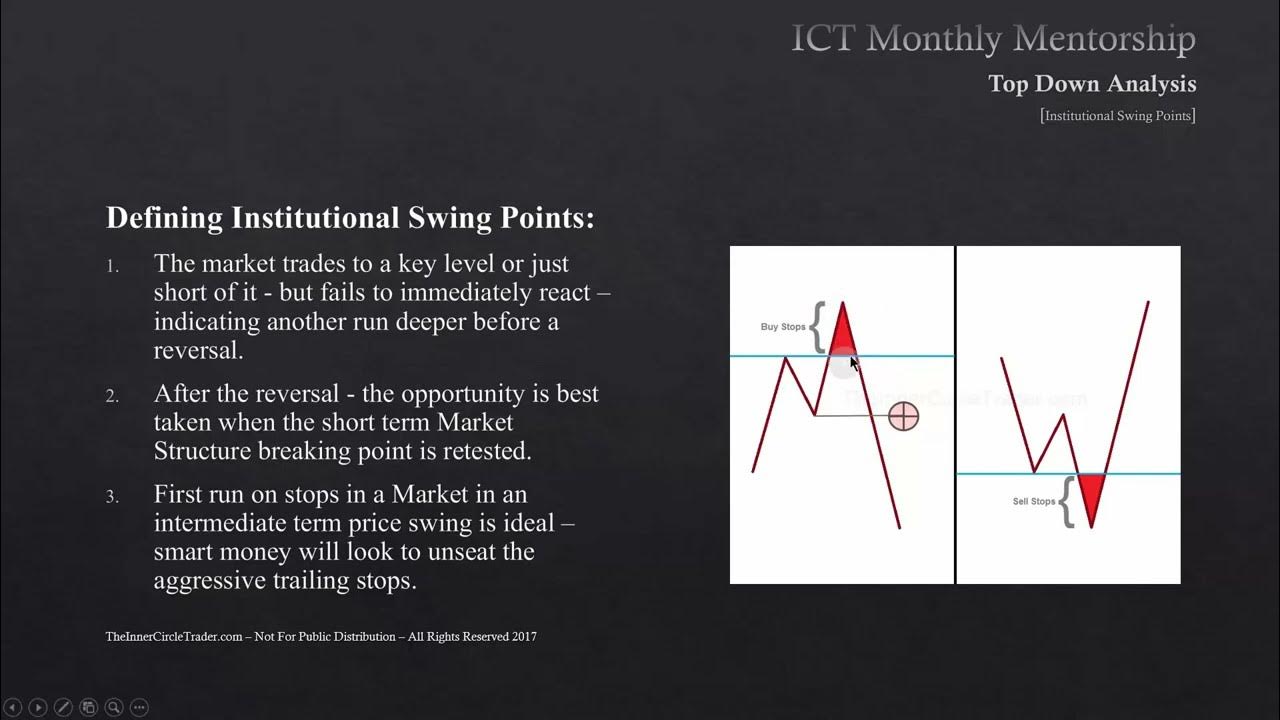
-This pattern signals a potential market reversal on Wednesday. In a bullish version, price consolidates Monday-Tuesday, dips into a discount array to trigger sell stops, and then reverses upward. The bearish version works inversely, with a run into a premium array to trigger buy stops before reversing lower.
Why does ICT emphasize studying historical price data when learning these weekly profiles?
-Because the effectiveness and recognition of these profiles become clear only through backtesting and observation. By studying historical price movements, traders can recognize recurring patterns and verify how these setups typically unfold in real market conditions.
What are 'premium' and 'discount' arrays, and why are they crucial in these setups?
-Premium arrays are areas where price is considered overvalued, while discount arrays represent undervalued zones. Understanding these areas helps traders anticipate where institutional buying or selling is likely to occur, forming the basis of weekly highs or lows.
Outlines

هذا القسم متوفر فقط للمشتركين. يرجى الترقية للوصول إلى هذه الميزة.
قم بالترقية الآنMindmap

هذا القسم متوفر فقط للمشتركين. يرجى الترقية للوصول إلى هذه الميزة.
قم بالترقية الآنKeywords

هذا القسم متوفر فقط للمشتركين. يرجى الترقية للوصول إلى هذه الميزة.
قم بالترقية الآنHighlights

هذا القسم متوفر فقط للمشتركين. يرجى الترقية للوصول إلى هذه الميزة.
قم بالترقية الآنTranscripts

هذا القسم متوفر فقط للمشتركين. يرجى الترقية للوصول إلى هذه الميزة.
قم بالترقية الآنتصفح المزيد من مقاطع الفيديو ذات الصلة

Market Maker Models in Smart Money Trading

DDTR - A Strategy That Manipulates Retail Traders Daily

THIS Weekly Profile Will Change The Way You See Price, Forever
ICT Mentorship Core Content - Month 05 - Defining Institutional Swing Points

ICT Mentorship Core Content - Month 03 - Institutional Sponsorship

Pahami 6 Prinsip Ini Untuk Menambah Akurasi Analisa || Prinsip Smart Money Concept || Full Course
5.0 / 5 (0 votes)
