Lab 6 Measurements - RL Circuit
Summary
TLDRIn this detailed video, the process of setting up and testing a circuit with a resistor and inductor is demonstrated. The presenter connects the circuit to an oscilloscope to measure key parameters such as phase difference and peak-to-peak voltage at different frequencies. The focus is on adjusting the frequency to achieve a 45-degree phase difference, measuring voltage at various points, and observing how the values change as the frequency is altered. The process includes testing different inductors and calculating voltage values for multiple frequencies, offering a thorough exploration of the lab experiment on circuit analysis.
Takeaways
- 😀 The circuit consists of a resistor in series with an inductor, which is connected to an oscilloscope for measurement.
- 😀 AC voltage from a wave generator is applied to the circuit, and voltage measurements are taken over both the input and the inductor.
- 😀 The phase difference between the two curves (input voltage and voltage across the inductor) should ideally be 45 degrees for accurate measurement.
- 😀 The frequency of the wave generator is adjusted to achieve the correct phase difference, with the frequency set around 204 kHz for optimal results.
- 😀 The peak-to-peak voltage over the inductor is measured, and the oscilloscope is adjusted to ensure a clear, accurate reading.
- 😀 Different frequencies are tested, including multiples and fractions of the central frequency (204 kHz), to observe the impact on voltage and phase difference.
- 😀 Frequency adjustments are made in increments, such as one-tenth, half, double, five times, and ten times the base frequency, to assess their effect on the circuit's behavior.
- 😀 The TDK inductor is tested in a similar manner, with the goal of achieving a 45-degree phase difference, requiring slight frequency adjustments in the range of 15-16 kHz.
- 😀 For the TDK inductor, peak-to-peak voltage is measured at various frequencies, including 1.53 kHz, 3.06 kHz, 7.6 kHz, 15.3 kHz, 30.6 kHz, and 153 kHz.
- 😀 The oscilloscope is used for fine-tuning frequency and voltage readings, zooming in on specific values for accurate measurements and to avoid errors such as clipped or fuzzy data.
Q & A
What is the primary goal of the experiment described in the script?
-The primary goal of the experiment is to measure the phase difference between the voltage curves in an LC circuit and analyze the voltage behavior at various frequencies.
How is the phase difference between the two voltage curves adjusted during the experiment?
-The phase difference is adjusted by tuning the frequency of the wave generator until the phase difference between the two voltage curves reaches 45 degrees.
Why is it important to measure the phase difference in this experiment?
-Measuring the phase difference is crucial to understanding the relationship between the input voltage and the voltage across the inductor, particularly in resonance conditions, which are key to the circuit's behavior.
What role does the oscilloscope play in this experiment?
-The oscilloscope is used to visualize the voltage waveforms, measure the phase difference between the input and inductor voltages, and determine the peak-to-peak voltage values at various frequencies.
How is the frequency of the wave generator adjusted during the experiment?
-The frequency of the wave generator is adjusted through its interface, with the goal of tuning the frequency until the phase difference between the two voltage curves is 45 degrees, and to observe the effect on the inductor's voltage output.
What happens if the frequency is too low in this circuit setup?
-If the frequency is too low, the voltage curve across the inductor will be smaller, making it harder to observe the expected output, as the impedance of the inductor at lower frequencies is lower.
Why is zooming in on the oscilloscope important for accurate phase and voltage measurements?
-Zooming in on the oscilloscope allows for more precise measurement of the phase difference and peak-to-peak voltage, avoiding errors caused by clipping or insufficient resolution at higher zoom levels.
What is the significance of measuring peak-to-peak voltage in this experiment?
-Measuring the peak-to-peak voltage provides information on the amplitude of the voltage waveforms, which is essential for understanding how the circuit behaves at different frequencies.
How does increasing the frequency affect the inductor in this circuit?
-Increasing the frequency increases the impedance of the inductor, which in turn affects the voltage across the inductor, making it important to adjust the frequency to observe clear voltage curves.
What measurements are taken at different frequencies in the experiment?
-At different frequencies, the peak-to-peak voltage across the inductor is measured, starting from the central frequency of 204 kHz and testing at multiples such as 10%, 20%, 50%, and up to 10 times the base frequency.
Outlines

هذا القسم متوفر فقط للمشتركين. يرجى الترقية للوصول إلى هذه الميزة.
قم بالترقية الآنMindmap

هذا القسم متوفر فقط للمشتركين. يرجى الترقية للوصول إلى هذه الميزة.
قم بالترقية الآنKeywords

هذا القسم متوفر فقط للمشتركين. يرجى الترقية للوصول إلى هذه الميزة.
قم بالترقية الآنHighlights

هذا القسم متوفر فقط للمشتركين. يرجى الترقية للوصول إلى هذه الميزة.
قم بالترقية الآنTranscripts

هذا القسم متوفر فقط للمشتركين. يرجى الترقية للوصول إلى هذه الميزة.
قم بالترقية الآنتصفح المزيد من مقاطع الفيديو ذات الصلة

Understanding Automatic Street Light Using LDR (ADC) | Raspberry Pi Pico With Micropython | Part-6
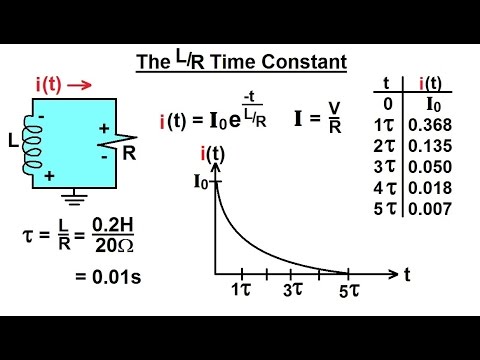
Electrical Engineering: Ch 8: RC & RL Circuits (11 of 43) The L/R Time Constant

State Space Model 4
The Ultimate Guide to Understanding Inductance and Inductors
RC and RL Circuits

Logisim // 2-finding the TRUTH TABLE of a Circuit
5.0 / 5 (0 votes)
